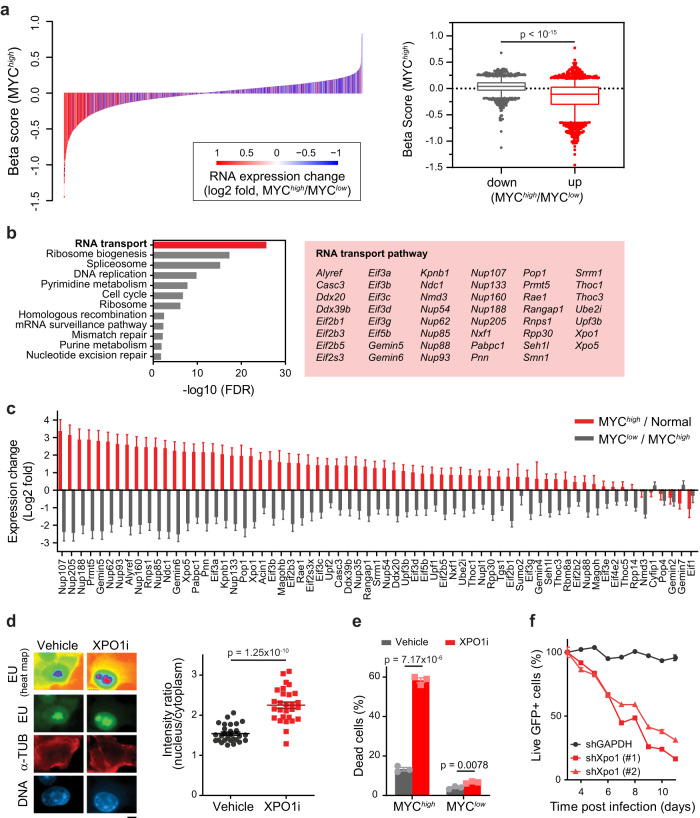
Fig. 3. MYC-driven HCC cells depend on XPO1 activity.
a Correlation analysis of MYC-regulated gene expression and gene essentiality. Left: Differential gene expression (MYChigh/MYClow, log2-fold change) is plotted against gene essentiality. Gene expression was determined in the context of MYC-induced HCC development (MYChigh HCC (n = 6 mice)) and MYC inactivation-induced tumor regression (MYClow HCC (n = 3 mice)) by RNA sequencing. Right: Gene essentiality (Beta score) is plotted for genes that are either significantly up or down regulated in MYChigh compared to MYClow HCC (adjusted p-value < 0.05). Box: 25–75 percentile, whiskers: 5–95 percentile, line: median, data points outside of 5–95 percentile are shown. The p-value was determined by two-tailed Mann-Whitney U test. b Results of KEGG pathway analysis of MYC-upregulated MYC-SL genes. Significantly enriched pathways (FDR < 0.05) are shown. RNA transport pathway genes identified as MYC-SL are highlighted in red box. c Gene expression changes of MYC-SL RNA transport genes in the context of MYC-induced HCC development (red: MYChigh HCC (n = 6 mice) vs. normal liver tissue (n = 2 mice)) and MYC inactivation-induced tumor regression (grey: MYClow HCC (n = 3 mice) vs. MYChigh HCC). Gene expression was determined by RNA sequencing (bars: mean, error bars: SE). d Epifluorescence images of total RNA (heat map, and green) by EU labeling in MYC-driven HCC cells upon XPO1 inhibition by Selinexor (scale bar = 5 μm). Staining of alpha-tubulin (red) and DNA (blue) were used for segmentation of nucleus and cytoplasm. Quantification of RNA abundance in the nucleus versus cytoplasm per cell (n = 28 cells examined in one experiment). Lines are means +/− SEM. The p-value for the two-tailed Student’s t-test is shown. e Flow cytometric analysis of EC4 cells with high MYC expression (MYChigh) or MYC transgene expression shut off (MYClow) by doxycycline treated with XPO1 inhibitor Selinexor. Survival was assessed by propidium iodide/AnnexinV staining. Graph shows quantification of three independent experiments (bars: mean, error bars: SEM). The p-value for the two-tailed Student’s t-test is shown. f Flow cytometric analysis of MYC-driven HCC cells expressing shRNAs targeting Xpo1 (two different Xpo1-targeting shRNAs) or GAPDH as a control in combination with GFP as a reporter. Live cells were detected by propidium iodide exclusion. Shown is the percentage of shRNA expressing (GFP+) live cells over time. Lines connect means of technical triplicates. For this figure, source data are provided as a Source Data file.

