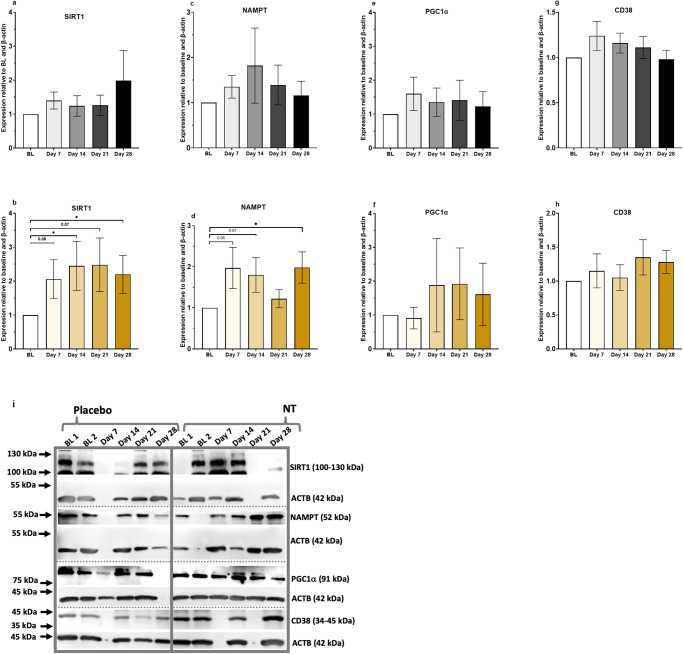
Fig. 6. Relative quantities of SIRT1, NAMPT, PGC1α, and CD38 protein in PBMCs in trial participants measured by western blotting.
a, c, e, g Placebo. b, d, f, h NT. Data are expressed as mean ± SEM; n = 18–21 and are relative to corresponding signal for ACTB and normalised to the measurement at baseline, which was used and is plotted as the mean of the two baseline samples (BL1 and BL2) collected at the same time of day in the week preceding the intervention. Gels for each primary antibody used derive from the same experiment and were processed in parallel. The four participants who showed the highest increases in whole blood NAD+ concentration (numbers 11, 17, 23, 26; Fig. 3 and Supplementary Table 1), as well as the late responder (number 18), were included in all western blot assays. *P < 0.05 by Student’s t-test. i Representative western blots for each antibody, as labelled, with corresponding signals for ACTB.

