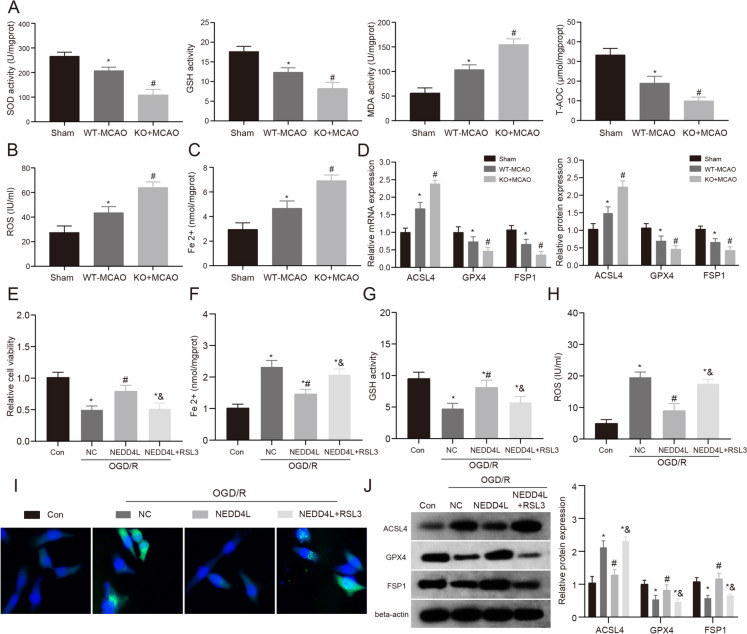
Fig. 3.
The regulatory role of NEDD4L in ferroptosis during MCAO and OGD/R models. A. In this study, the contents of SOD, GSH, MDA, and T-AOC in each treatment group were detected. B. The contents of ROS in each treatment group were detected. C. The contents of Fe 2 + in each treatment group were detected. D. QRT-PCR and WB were used to detect the expression levels of ferroptosis markers in each treatment group. n = 6, * vs Sham group P < 0.05, # VS WT-MCAO group P < 0.05. E. Cell viability was assayed using a CCK-8 kit. F. The contents of Fe 2 + in HT-22 of each treatment group were detected. G. The contents of GSH in HT-22 of each treatment group were detected. H. The contents of ROS in HT-22 of each treatment group were detected. I. Confocal imaging of BODIPYC11-ROS was performed in HT-22 cells treated with 1 μM RSL3. J. WB was used to detect the expression levels of ferroptosis markers in HT-22 of each treatment group. n = 3, * vs Con group P < 0.05, # vs NC + OGD/R group P < 0.05, & vs NEDD4L + OGD/R group P < 0.05

