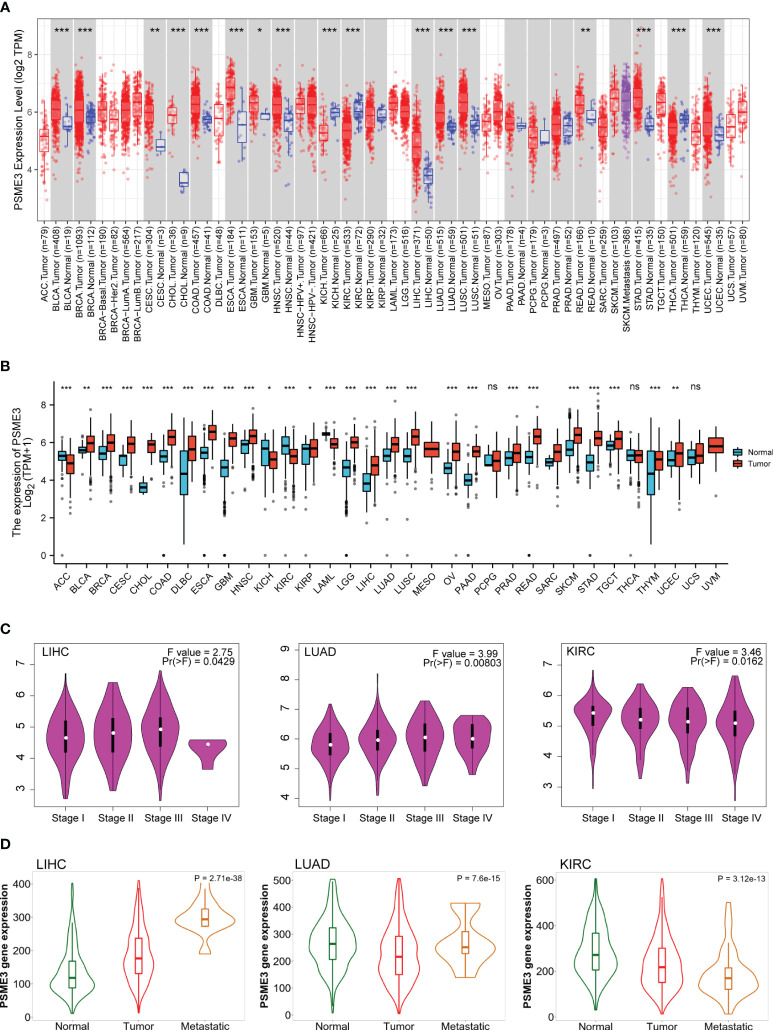
Figure 1.
Differential expression of PSME3 (A) PSME3 mRNA expression levels in 33 different tumor types derived from TCGA database. Red columns represent cancer samples, and blue columns represent normal samples. *P<0.05, **P<0.01. (B) Comparison of PSME3 expression between tumor and normal tissues, combining data from TCGA and GTEx. *P<0.05, **P<0.01, ****P<0.001, NS (no significant differences). (C) Violin plots illustrating PSME3 mRNA levels at pathological stages (stages I, II, III, and IV) in various cancers. (D) Relationship between PSME3 expression and metastasis in different tumors [log2 transcript per million (TPM) + 1]; only cancers with statistically significant differences between pathological stages are presented.

