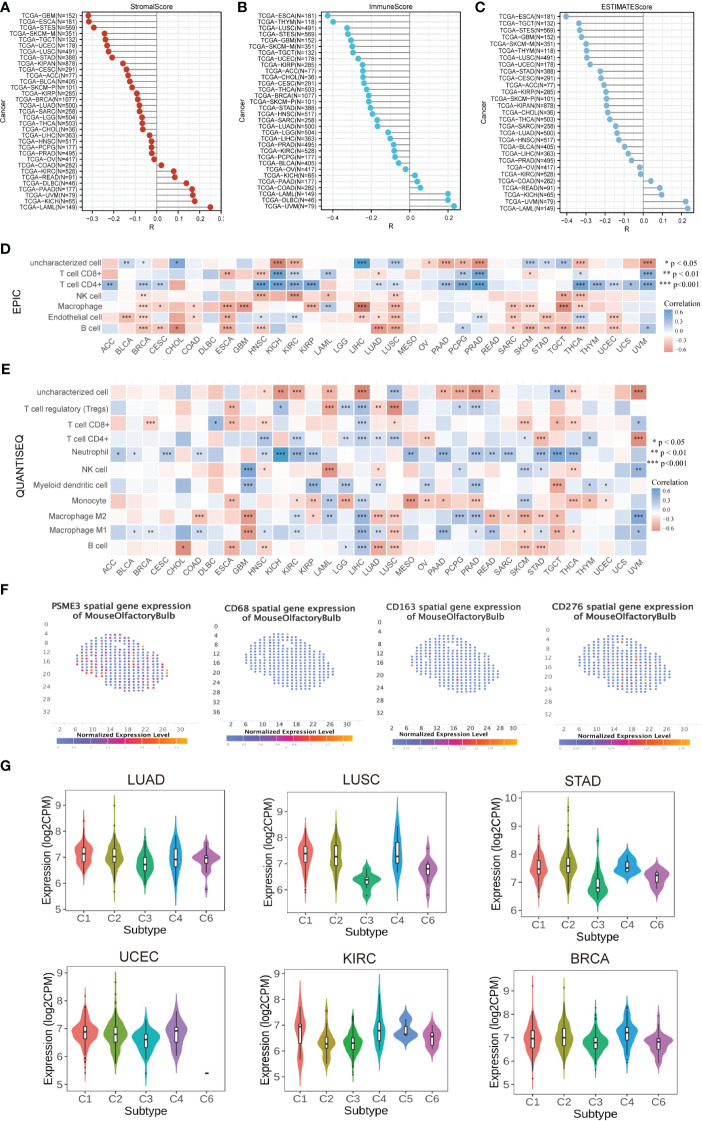
Figure 5.
Correlation and Immune Cell Infiltration Analysis (A) Stick map illustrating the correlation between PSME3 and StromalScore. (B) Stick map illustrating the correlation between PSME3 and ImmuneScore. (C) Stick map illustrating the correlation between PSME3 and ESTIMATEScore. (D) Immune cell infiltration analysis conducted using EPIC. (E) Immune cell infiltration analysis conducted using QuanTiseq. *P<0.05, **P<0.01, NS (no significant differences). (F) Spatial transcription sections displaying the spatial expression patterns of PSME3, CD68, CD276, and CD163 markers. Dot colors represent the expression levels of the markers. (G) Correlations between PSME3 and immune subtypes were analyzed with the TSIDB online tool.

