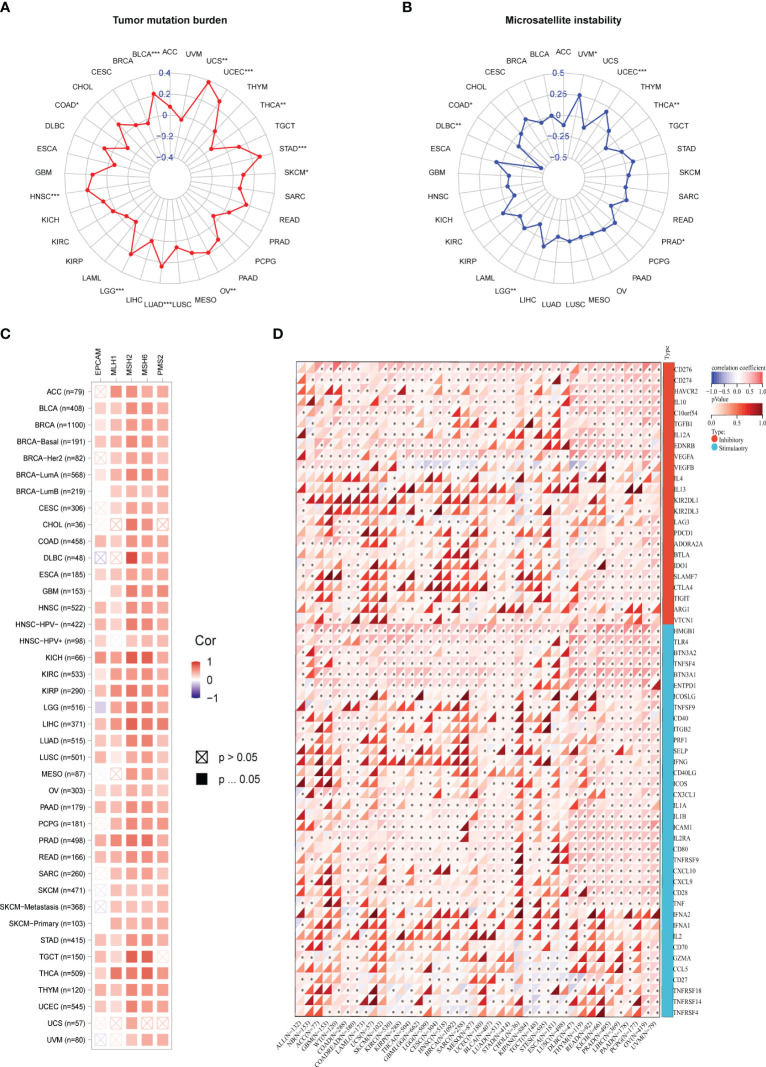
Figure 6.
(A) Correlation Between PSME3 mRNA Expression and TMB. (B) Correlation Between PSME3 mRNA Expression and MSI. (C) Heatmap illustrating the expression of PSME3 and MMR pathway genes. (D) Heatmap depicting the relationship between immune checkpoint genes and PSME3 expression in pan-cancer analysis. *P < 0.05, **P < 0.01, ***P < 0.001.

