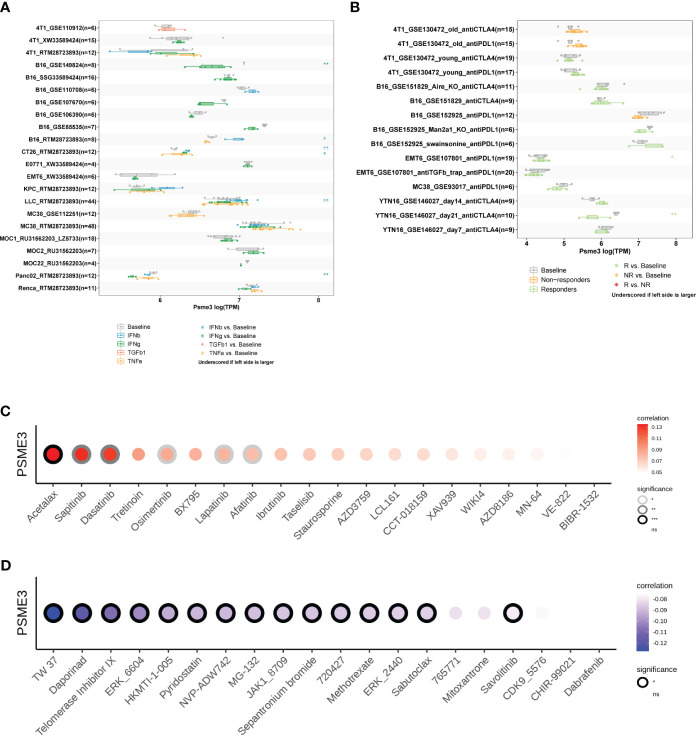
Figure 8.
(A) Multiple boxplots illustrate the expression of PSME3 in cancer cell lines before and after cytokine treatment, as obtained from the TISMO web tool. Significance levels are indicated as follows: *, **, and *** represent P values of < 0.05, < 0.01, and < 0.001, respectively. (B) Multiple boxplots depict the expression of PSME3 in cancer cell lines before and after PDL1 or CTLA4 treatment, as obtained from the TISMO web tool. Significance levels are denoted as follows: *, **, and *** denote P values of < 0.05, < 0.01, and < 0.001, respectively. Based on drug sensitivity analysis in GDSC (Genomics of Drug Sensitivity in Cancer), the following are the top 15 drugs that are positively correlated (C) and negatively correlated (D) with PSME3 expression, as shown in the figure. *P<0.05, **P<0.01, NS (no significant differences).

