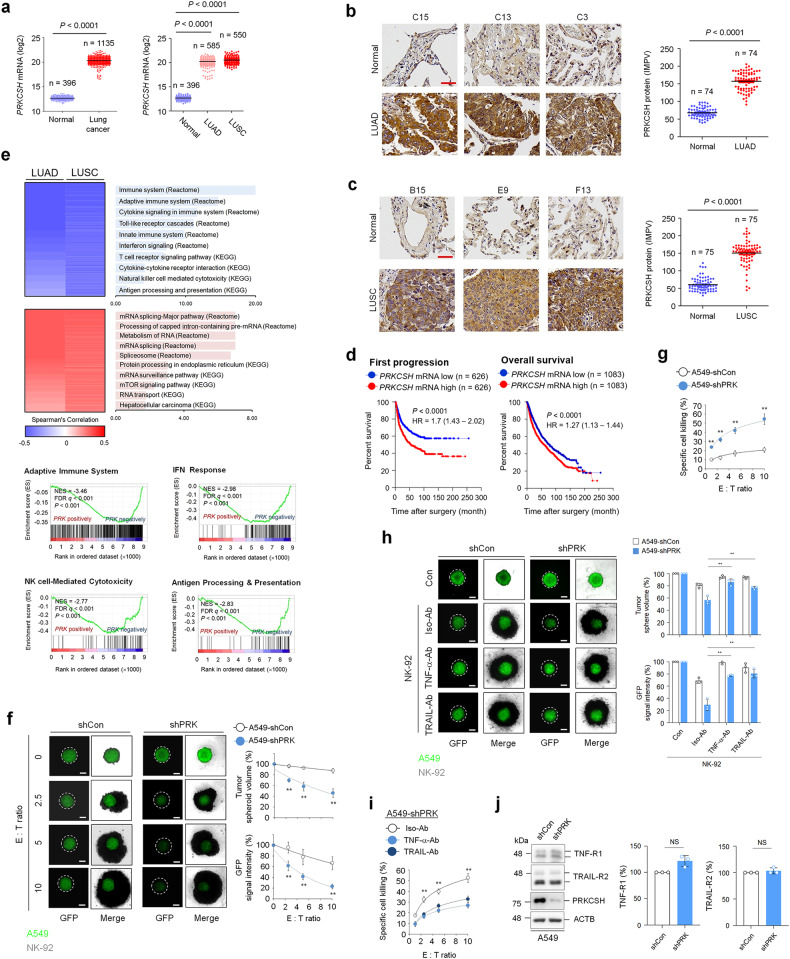
Fig. 1. High expression of PRKCSH in lung cancer represses NK cell-mediated cytotoxicity.
a Quantitative analysis of PRKCSH mRNA expression levels between normal (n = 396) and cancerous (n = 1135) lung tissues, including lung adenocarcinoma (LUAD) (n = 585) and lung squamous cell carcinoma (LUSC) (n = 550). The gene expression profiles were obtained from The Cancer Genome Atlas and Genotype-Tissue Expression databases. Data are presented as the mean ± the two-tailed Student determined SD. Statistical significance’s t test. b Representative images of immunohistochemical staining of PRKCSH in LUAD (n = 74 LUAD tissues; n = 74 adjacent tissues) (scale bar = 50 μm). Quantitative analysis of PRKCSH expression levels in paired clinical samples. c Representative images of immunohistochemical staining of PRKCSH in LUSC (n = 75 of LUSC tissues; n = 75 of adjacent tissues) (scale bar = 50 μm). Quantitative analysis of PRKCSH expression levels in paired clinical samples. d Kaplan‒Meier plot of the first progression rate or overall survival rate of patients with lung cancer stratified by PRKCSH mRNA expression level. Patients were divided into two groups: high PRKCSH mRNA expression vs. low PRKCSH mRNA expression. The significance of differences was determined by the two-sided log-rank test. e Two-dimensional hierarchical clustering shows top-ranked pathways in transcriptome analysis showing negatively coexpressed genes relative to PRKCSH mRNA expression (blue) and positively coexpressed genes (red) in LUAD and LUSC tissues. Gene-set enrichment analysis of negatively coexpressed genes with PRKCSH mRNA in LUSC tissues. NES, normalized enrichment score; FDR q, false discovery rate q value. f NK cell-A549 cell killing assay in tumor 3D spheroid culture (scale bar = 200 μm). The tumor organoids of A549-shCon and A549-shPRK cells were treated with NK-92 cells at the indicated E:T ratio for 5 days. The NK cell-mediated cytotoxicity against tumor organoids was analyzed by measuring spheroid volume and GFP signal intensity. Data are shown as the means ± SDs of three independent assays. The statistical significance of differences between two groups was determined with the two-tailed Student’s t test. **p < 0.01. g NK cell-A549 cell killing assay in tumor cell 2D culture. A549-shCon and A549-shPRK cells were seeded onto culture dishes following treatment of NK-92 cells at the indicated E:T ratio for 4 h. The NK cell-mediated cytotoxicity against tumor cells was measured using a lactate dehydrogenase release assay. h The inhibition assay of NK cell cytotoxicity with neutralizing antibodies against TNF-α or TRAIL in tumor 3D spheroid culture (scale bar = 200 μm). The tumor organoids of A549-shCon and A549-shPRK cells were treated with a complex of the neutralizing antibody and NK-92 cells for 5 days. The NK cell cytotoxicity against tumor organoids was analyzed by measuring spheroid volume and GFP signal intensity. i The inhibition assay of NK cell cytotoxicity with neutralizing antibodies against TNF-α or TRAIL in tumor cell 2D culture. A549-shCon and A549-shPRK cells were treated with the complex of the neutralizing antibody and NK-92 cells for 4 h. The NK cell-mediated cytotoxicity against tumor cells was measured by a lactate dehydrogenase release assay. j Immunoblot analysis of TNF-R1 and TRAIL-R2 expression in A549-shCon and A549-shPRK cells. Representative immunoblots and quantitative analysis of gene expression levels in A549-shCon and A549-shPRK cells are shown. ACTB was used as a loading control.

