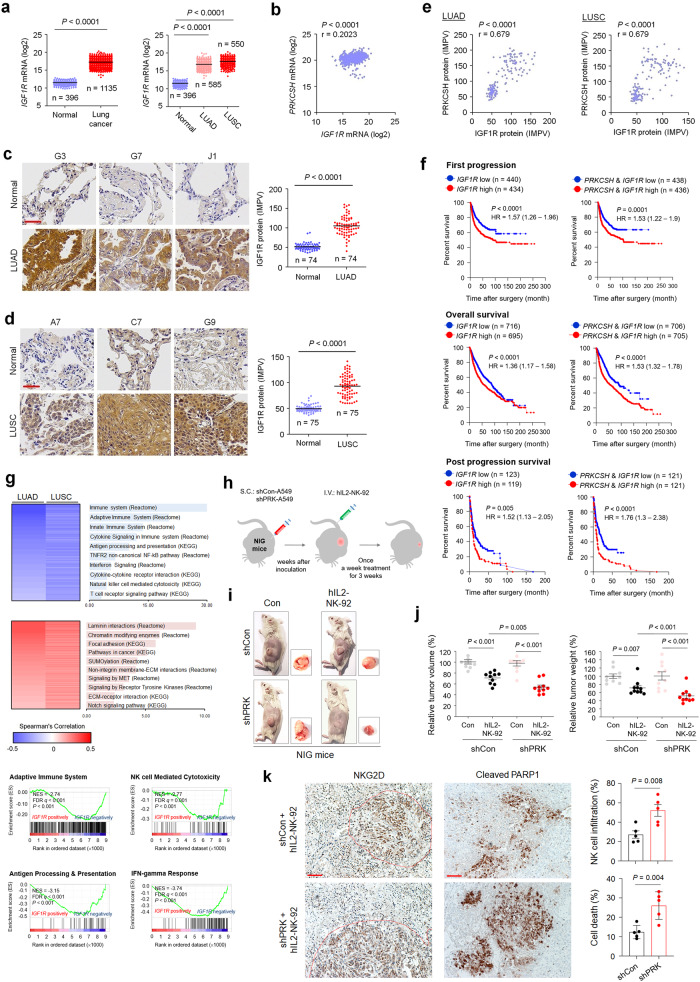
Fig. 8. The impact of PRKCSH protein on increasing IGF1R protein levels in lung cancer tissues and the NK cell-mediated antitumor effect in vivo.
a Quantitative analysis of IGF1R mRNA expression levels between normal (n = 396) and cancerous (n = 1135) lung tissues, including lung adenocarcinoma (LUAD) (n = 585) and lung squamous cell carcinoma (LUSC) (n = 550). The gene expression profiles were obtained from The Cancer Genome Atlas and Genotype-Tissue Expression databases. Data are presented as the mean ± SD. Statistical significance was determined by the two-tailed Student’s t test. b Representative immunohistochemical staining of IGF1R protein in LUAD (n = 74 of LUAD tissues; n = 74 of adjacent tissues) (scale bar = 50 μm). Quantitative analysis of IGF1R expression levels in paired clinical samples. c Representative immunohistochemical staining of IGF1R protein in LUSC (n = 75 of LUSC tissues; n = 75 of adjacent tissues) (scale bar = 50 μm). Quantitative analysis of IGF1R expression levels in paired clinical samples. d Analysis of the correlation between PRKCSH and IGF1R mRNA levels in lung cancer tissues using the gene expression profiles obtained from The Cancer Genome Atlas database. Correlation analysis was performed using Pearson’s rank correlation coefficient. e Analysis of the correlation between PRKCSH and IGF1R protein levels in lung cancer tissues using the immunohistochemical data determined in LUAD and LUSC tissues. f Kaplan‒Meier plot of the first progression rate, overall survival rate, or post progression survival rate of patients with lung cancer stratified by IGF1R mRNA expression level. Patients were divided into two groups: high IGF1R mRNA expression vs. low IGF1R mRNA expression. Statistical differences were determined by the two-sided log-rank test. g Two-dimensional hierarchical clustering shows top-ranked pathways in transcriptome analysis showing negatively coexpressed genes relative to IGF1R mRNA expression (blue) and positively coexpressed genes (red) in LUAD and LUSC tissues. Gene-set enrichment analysis of coexpressed genes with IGF1R mRNA in LUSC tissues. NES, normalized enrichment score; FDR q, false discovery rate q value. h‒j The effect of PRKCSH knockdown on the NK cell-mediated antitumor effect using the tumor-bearing IL-2Rg-deficient NOD/SCID (NIG) mouse model (each group, n = 10). A549-shCon and A549-shPRK cells were inoculated subcutaneously into the mice, and human IL2-NK-92 cells were injected intravenously into the mice at 3 weeks after inoculation (h). Tumor volume and weight were measured on Day 40 after inoculation. Representative tumor-bearing mice and enucleated tumors (i) and quantitative analysis of tumor volume and weight (j) are shown. k Representative immunohistochemical staining of cell death (cleaved PARP1) and NK cell infiltration (NKG2D) in tumor tissues of xenograft mice (each group, n = 5) (scale bar = 50 μm). Quantitative analysis of cell death and NK cell infiltration levels.

