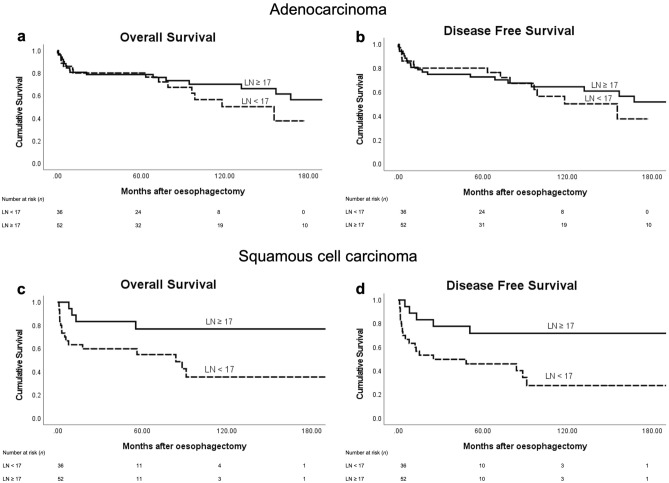
Figure 2.
Kaplan–Meier survival curves for histological subtypes (adenocarcinoma, n = 88 vs squamous cell carcinoma, n = 49) based on number of resected lymph nodes (LN) in pN0 oesophageal cancer (17 or more LNs versus less than 17 LNs). (a) Adenocarcinoma—Overall survival (Log Rank, P = 0.322), (b) Adenocarcinoma—Disease Free survival (Log Rank, P = 0.622). (c) Squamous cell carcinoma—Overall survival (Log Rank, P = 0.047), (d) Squamous cell carcinoma—Disease Free survival (Log Rank, P = 0.013). Numbers below graphs indicate the number of patients at risk at each time point for the LN groups.

