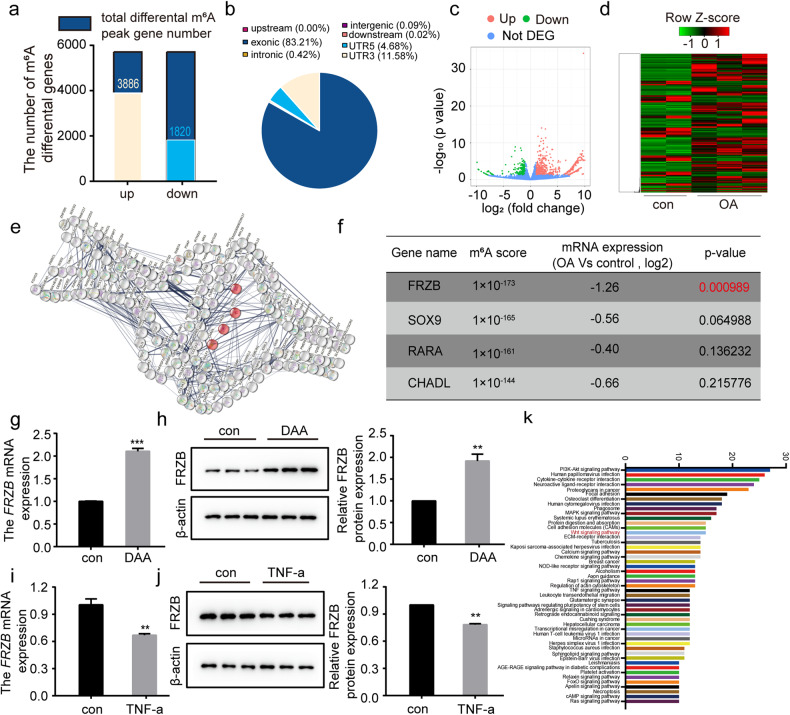
Fig. 4. The Wnt pathway inhibitor FRZB abnormally elevated m6A methylation in OA.
a Statistical analysis of m6A peak gene number. b The distribution of different m6A peaks in different regions of the reference genome. c Volcano plot illustrating the distributions of differentially expressed m6A genes. d Heatmap of differential gene clustering. e Functional analysis of hypermethylated genes based on the STRING database (the genes marked in red are genes related to cartilage development, https://cn.string-db.org/). f Cartilage development-related genes corresponding to the methylation sequencing score, gene expression and P value score. g, h FRZB expression was assessed by qRT‒PCR (g) and Western blotting (h) in human chondrocytes with or without treatment with the m6A methylation inhibitor DAA (50 µM). i, j FRZB expression was assessed in human chondrocytes treated with TNF-α (50 ng/ml). Relative FRZB expression measured by qRT‒PCR (i), Western blotting and quantitative analysis (j) of FRZB protein in human osteoarthritic chondrocytes. k KEGG analysis of m6A difference genes in osteoarthritic (n = 3) vs. normal cartilage tissues (n = 2). Data are presented as the means ± SEMs. *P < 0.05; **P < 0.01; ***P < 0.001; ns, not significant.

