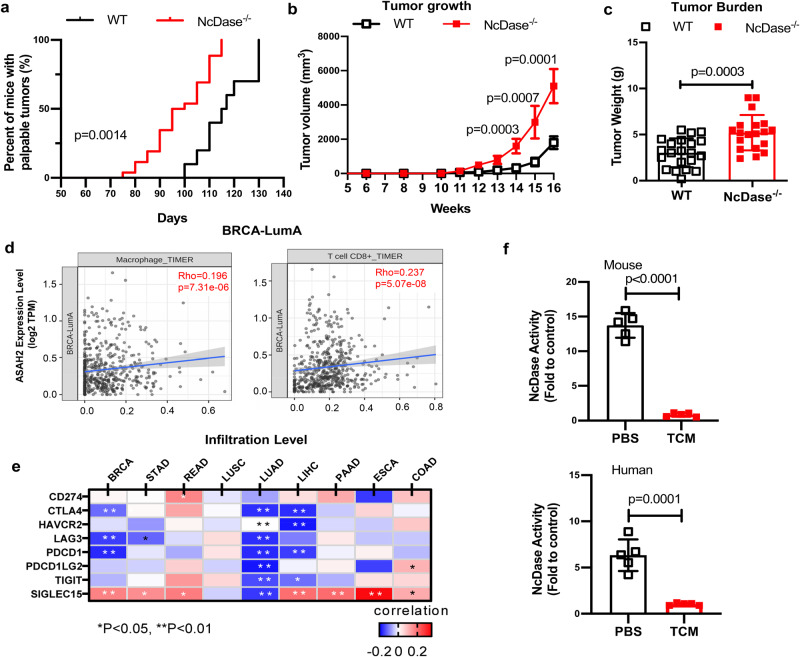
Fig. 1. Deletion of NcDase in the MMTV-PyMT model promotes tumor progression.
a–c Kaplan-Meier curves for tumor onsets at indicated times (a), tumor growth (b), and final tumor burden (c) in WT PyMT mice and NcDase−/− PyMT mice. n = 21 mice (WT) or 19 mice (NcDase−/−). d Correlation of NcDase expression (ASAH2) with infiltration level of indicated cell types in breast cancer LumA subtypes. Data were from the TIMER 2.0 web platform (n = 568). Spearman’s correlation coefficients and P values are shown. TPM transcript count per million reads. e Correlation between NcDase and immune regulatory markers across nine cancer types from TCGA are shown as a heatmap. BRCA: Breast invasive carcinoma (n = 1098); STAD: Stomach adenocarcinoma (n = 443); READ: Rectum adenocarcinoma (n = 171); LUSC: lung squamous cell carcinoma (n = 504); LUAD: Lung adenocarcinoma (n = 584); LIHC: Liver hepatocellular carcinoma (n = 377); PAAD pancreatic ductal adenocarcinoma (n = 185); ESCA: Esophageal carcinoma (n = 185); and COAD colon adenocarcinoma (n = 460). f The activity of NcDase in Raw264.7 macrophages and THP-1 derived macrophages that were co-cultured with mouse or human breast cancer conditioned medium for 48 h, respectively. n = 5 independent biological experiments. Statistical comparisons were performed using log-rank test (a), two-tailed unpaired t-test (b, c, f), Pearson’s correlation coefficient (PCC) (d, e), Error bars indicate mean ± SD. Source data and exact p values (e) are provided as a Source Data file.

