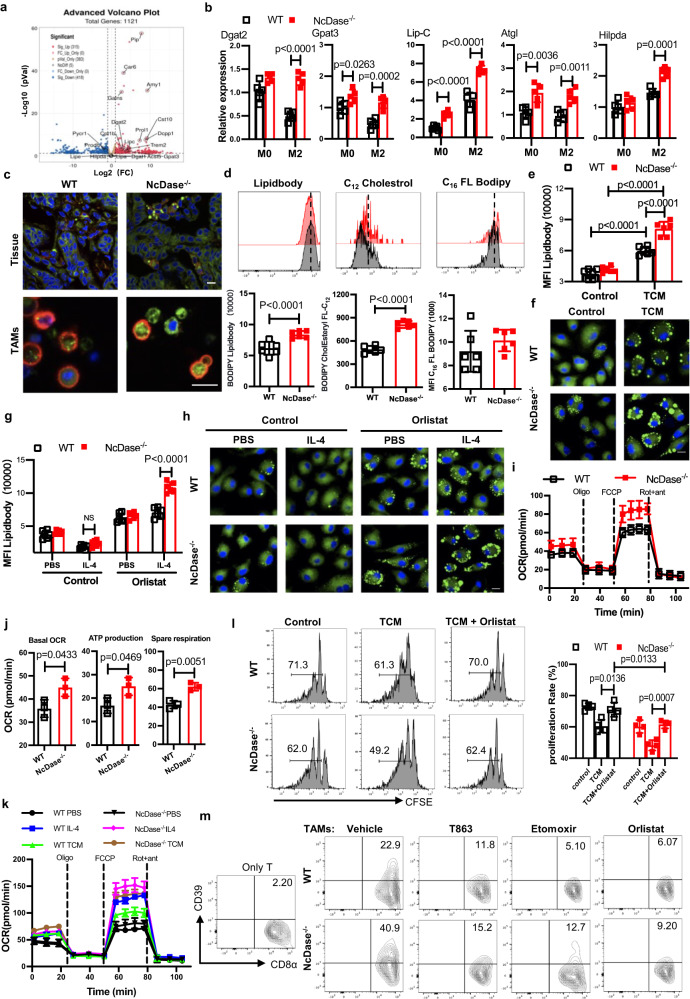
Fig. 5. NcDase is responsible for lipid droplet and lipolysis upstream of FAO.
a Volcano plots showing fold change (FC) and p value for the comparison of in TAMs sorted from WT PyMT or NcDase−/− PyMT mice. Genes up- or downregulated in TAMs (at FC > 2 and p < 0.05) are highlighted (red and blue). b Real-time PCR analysis of metabolic genes related to lipid droplets and lipolysis in M0 or M2 BMDMs derived from WT and NcDase−/− mice. c Representative images of lipid levels assessed by BODIPY493/503 staining (green) and F4/80 expression (red) in frozen sections of breast tumor (top) or in sorted TAMs (bottom) from PyMT WT mice or PyMT NcDase−/− mice. d Representative plots (top) and summary graphs of the MFI (bottom) of lipid quantification using BODIPY493/503 staining (left), the uptake of BODIPY-FL-C16 (middle) or BODIPY CholEsteryl FL-C12 (right) in CD11b+ F4/80+ TAMs from WT PyMT or NcDase−/− PyMT mice. e, f Lipid quantification using BODIPY493/503 staining by flow cytometry (e) or confocal microscopy (f) in PBS or TCM-derived BMDMs. Scale bar: 10 μm. g, h Lipid quantification using BODIPY493/503 staining by flow cytometry (g) or confocal microscopy (h) in PBS or IL-4-derived BMDMs with/without orlistat (100 μM) treatment. Scale bar: 10 μm. NS not significant. i, j OCR of TAMs from WT and NcDase−/− mice. k OCR of PBS, IL-4 or TCM-derived BMDMs from WT and NcDase−/− mice. l The proliferation of CFSElow/–CD8+ T cells after co-culturing with BMDMs. BMDMs were differentiated in either normal media, TCM or TCM+Orlistat (100 μM). m Quantification of the expression of Ly6C+CD39+ on CD8+ T cells that were co-cultured with WT or NcDase−/− TAMs. TAMs were treated with vehicle, T863 (50 μM), etomoxir (40 μM) or orlistat (100 μM) for 48 h. Two-sided Wilcoxon’s rank sum test (a), two-way ANOVA with Sidak’s multiple comparisons test (b, e, g, l), two-tailed unpaired t-test (d, j) were performed. Error bars indicate mean ± SD. n = 3 (a, i, j, k, m), 4 (l), 5 (b, c), 6 (d, e, f, g, h) independent biological samples. Source data are provided as a Source Data file.

