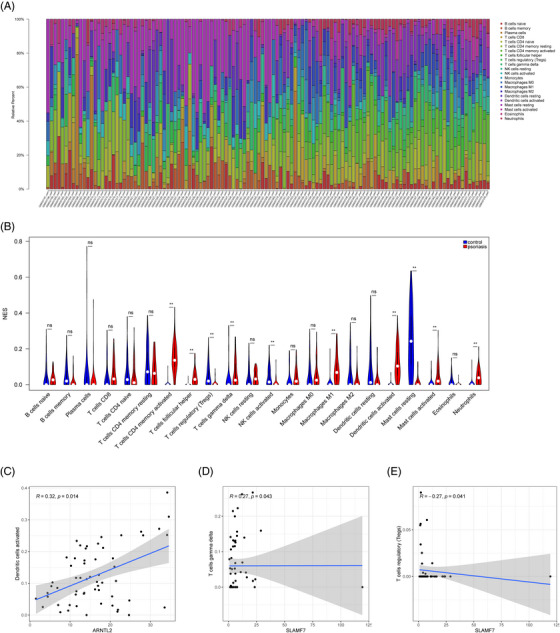
FIGURE 4.

Immune infiltration analysis of crucial genes in psoriasis. (A) The heatmap of immune cell infiltration between psoriasis and controls. (B) The violin plot to show the different distribution of each immune cell between psoriasis and control in GSE13355. (C) Correlation between ARNTL2 and infiltrating immune cells. (D and E) Correlation between SLAMF7 and infiltrating immune cells. ** p < 0.001.
