
FIGURE 5.
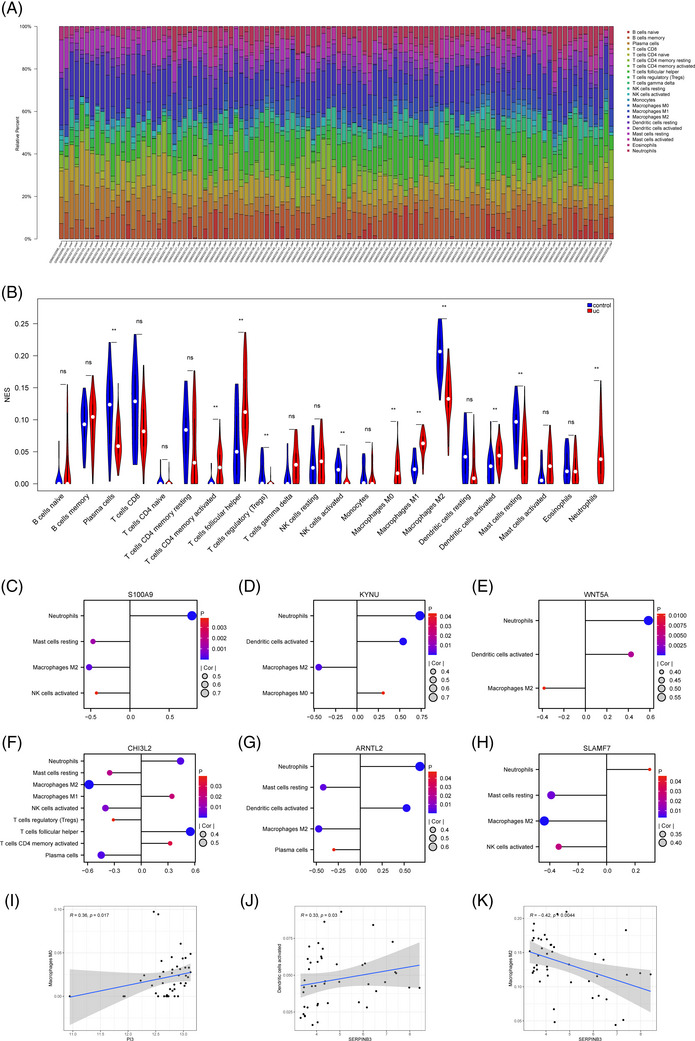
Immune infiltration analysis of crucial genes in UC. (A) The heatmap of immune cell infiltration between UC and controls. (B) The violin plot to show the different distribution of each immune cell between UC and control in GSE87466. (C) Correlation between S100A9 and infiltrating immune cells. (D) Correlation between KYNU and infiltrating immune cells. (E) Correlation between WNT5A and infiltrating immune cells. (F) Correlation between SLMAF7 and infiltrating immune cells. (G) Correlation between ARNTL2 and infiltrating immune cells. (H) Correlation between CHI3L2 and infiltrating immune cells. (I) Correlation between PI3 and infiltrating immune cells. (J and K) Correlation between SERPINB3 and infiltrating immune cells. ** p < 0.001.