Fig. 2.
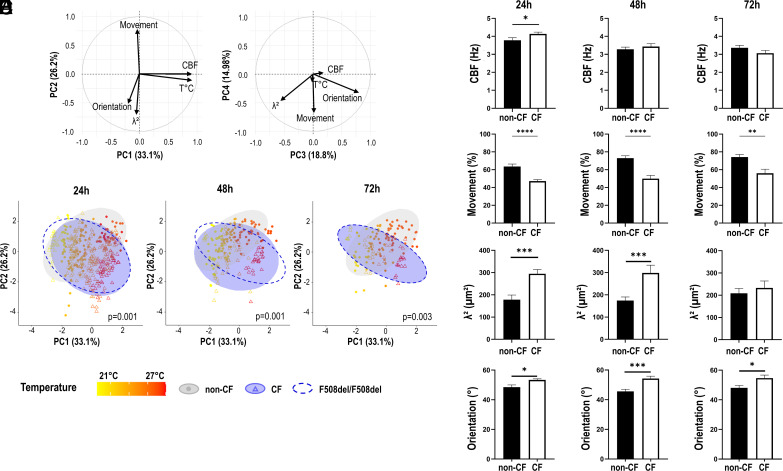
Distinct cilia beating phenotypes of CF and non-CF hNEC. The principal component analysis (PCA) was performed over 1,659 videos with five quantitative parameters: the percentage of movement (Movement), the temperature of acquisition (T°C), the cilia beat frequency (CBF), synchronization (λ2), and orientation (Orientation). (A) The correlation circles are displayed for the four first PC. (B) Cilia beating from CF and non-CF cultures (treated with vehicle) was recorded at different times after washing out the mucus: at 24 h (116 video of non-CF and 272 of CF hNEC), at 48 h (120 non-CF and 75 CF), and at 72 h (91 non-CF and 42 CF). The scatter plot on the first two PC is displayed. Ellipses were drawn using stat_ellipse function (package ggplot2) and calculated using multivariate Student distribution and 95% CI. PERMANOVA statistical tests were performed to compare the cilia beat phenotype (centroid) recorded on CF (blue) and non-CF hNEC (gray). Ellipses for the F508del homozygous samples only are also displayed (dotted line). The points are colored according to the temperature of acquisition from 21 °C to 27 °C. The analysis of cilia beating individual parameters was performed on the same records. (C) Cilia beat frequency (CBF). (D) Percentage of the video area covered by cilia beating (movement). (E) Synchronization defined as the surface size below which cilia beat in a homogeneous way (λ2). (F) Dispersion of cilia beat orientation. Each point relates to one video acquisition. Mean ± SEM; Mann–Whitney U tests; *P < 0.05, **P < 0.01, ***P < 0.001, and ****P < 0.0001.

