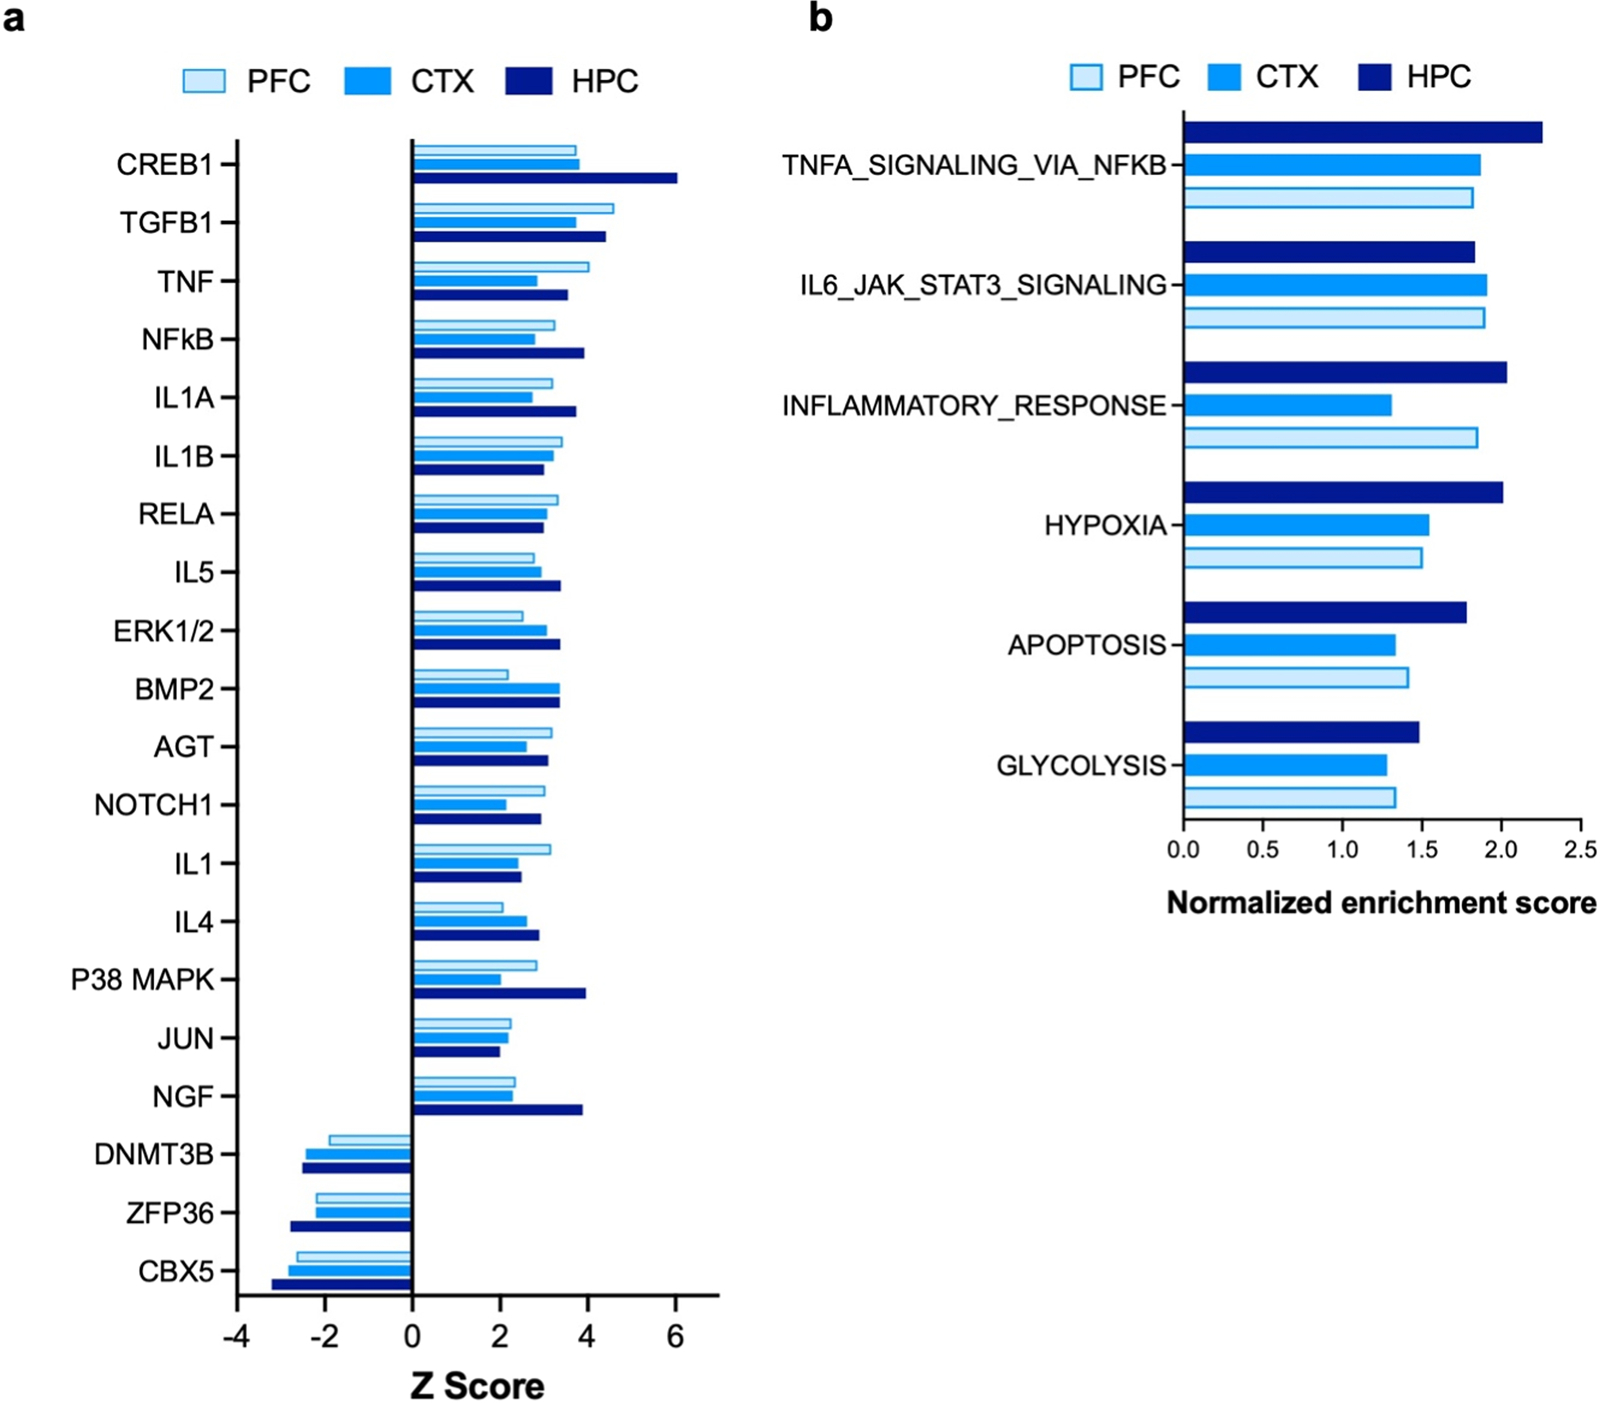
Fig. 8. |.

IPA upstream regulators and GSEA hallmark gene set analysis. (a) Bar graph showing commonly upregulated and downregulated upstream regulators identified by comparative analysis using IPA in the three forebrain regions. RNA-Seq DEG profiles from PFC, CTX and HPC of WwoxP47T/P47T samples vs. WwoxWT/WT were compared to identify top common altered upstream regulators pathways. (b) Bar graph showing pathways and bioprocesses enriched by GSEA hallmark gene set analysis in PFC, CTX, and HPC samples.
