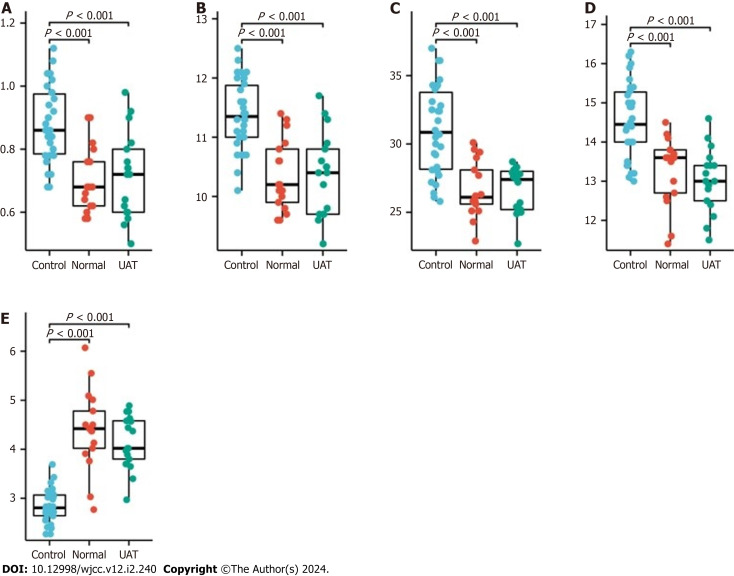
Figure 3.
Coagulation data in control normal women (n = 30), pregnant women (n = 17) and pregnant women with umbilical artery thrombosis (n = 17). A: Comparison of International Normalized Ratio among normal women (control), pregnant women (normal), and pregnant women with umbilical artery thrombosis (UAT) groups. B: Comparison of Prothrombin Time (s) among control, normal and UAT groups. C: Comparison of Activated Partial Thromboplastin Time (s) among control, normal and UAT groups. D: Comparison of Thrombin Time (s) among control, normal and UAT groups. E: Comparison of Fibrinogen (g/L) among control, normal and UAT groups. The P-values indicates significant differences.

