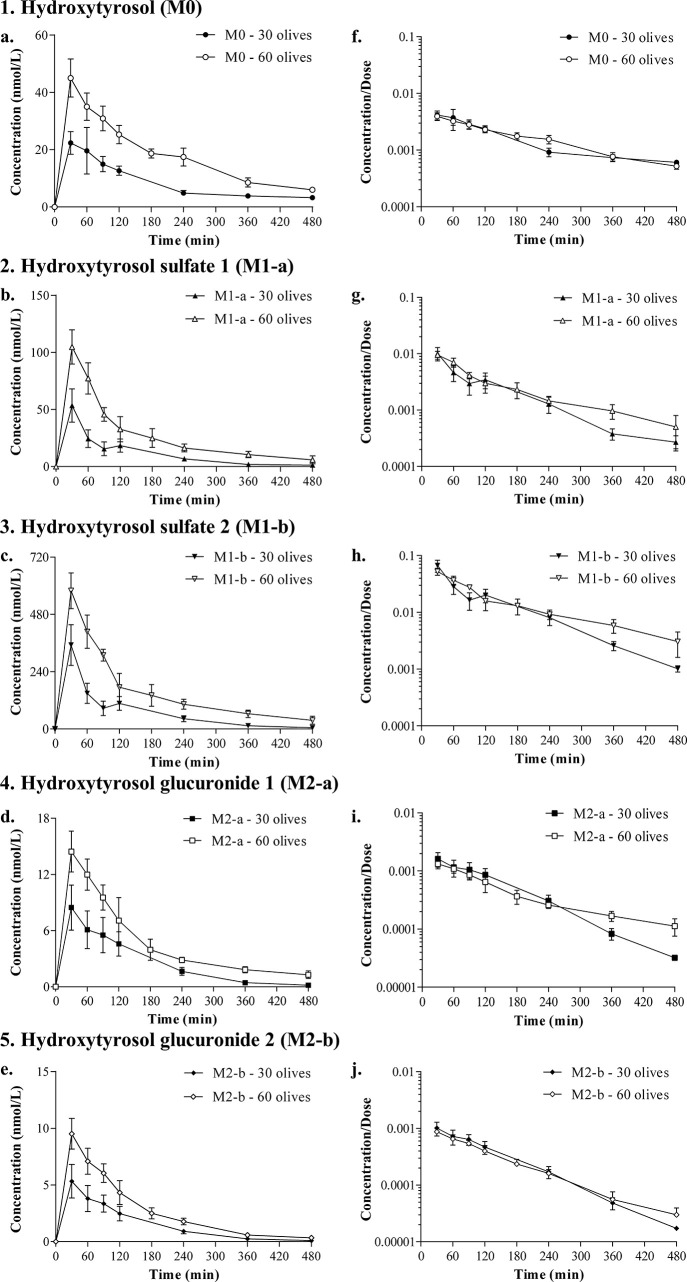
Figure 2.
Plasma concentrations versus time profiles of hydroxytyrosol (a) and its metabolites (b–e) obtained after the oral administration to Sprague-Dawley rats of Arbequina table olives containing hydroxytyrosol at 2.95 mg/kg (30 olives group) and 5.89 mg/kg (60 olives group). The ratio of the plasma concentrations of hydroxytyrosol (f) and metabolites (g–j) with the dose of hydroxytyrosol was represented in a semilogarithmic scale to assess the linearity between the two doses. Results are expressed as means ± SEMs in the 30 olives (n = 6) and 60 olives (n = 7) groups.

