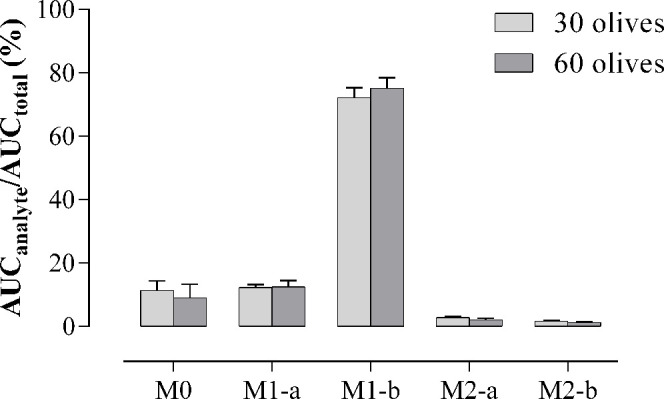
Figure 4.

Ratio of the area under the curve (AUC) of hydroxytyrosol (M0), hydroxytyrosol sulfates (M1-a, M1-b), and hydroxytyrosol glucuronides (M2-a, M2-b) with respect to the total AUC expressed in percentage obtained after the oral administration of 2.95 mg/kg (30 olives group) and 5.89 mg/kg (60 olives group) to Sprague-Dawley. Results are represented as means ± SEMs in the 30 olives (n = 6) and 60 olives (n = 7) groups.
