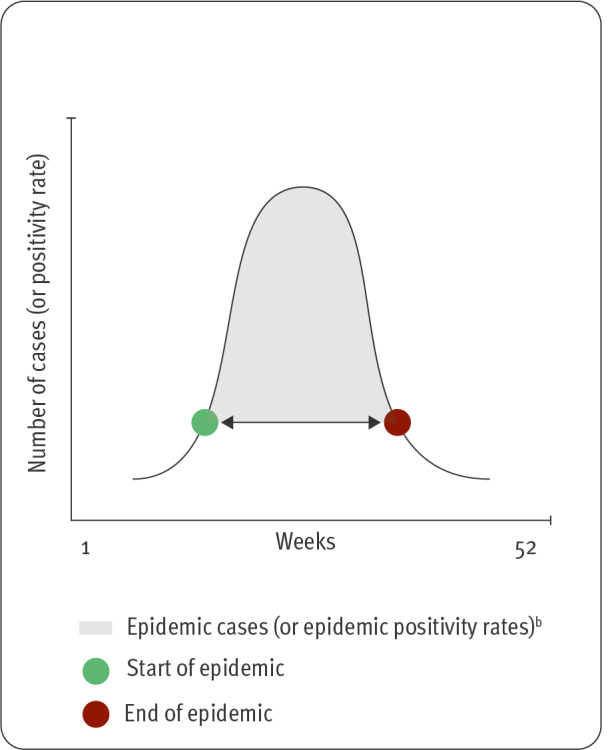
Figure 1.
Parameters used to characterise a respiratory syncytial virus epidemic (n = 3 parameters)a
a The three parameters are the start (green), end (red) and capture rate (grey).
b The shaded area (grey) represents either the numbers of cases belonging to the epidemic or the positivity rates during the epidemic. These values enable to calculate the capture rate (i.e. the proportion of annual cases who fall within the epidemic). Annual cases in the denominator of the capture rate are the number of cases detected by the surveillance system in a period of a year.
The arrow indicates the duration of the epidemic.

