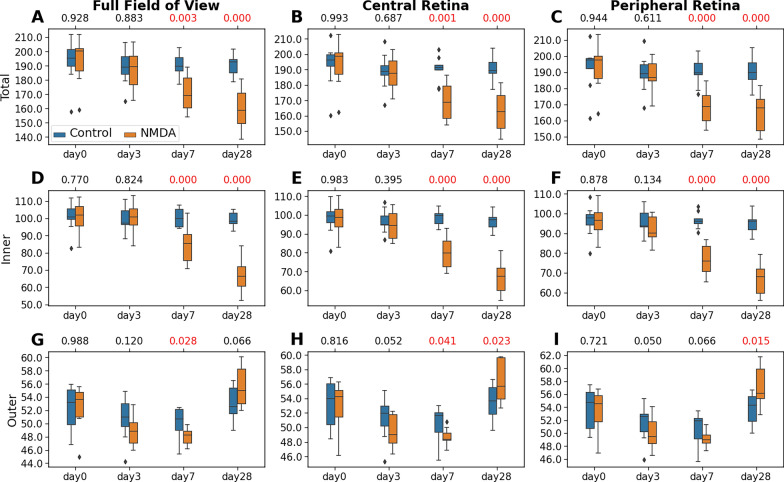
Fig. 5.
Statistical analyses of the thicknesses of the total retina (A–C), inner retina (ILM-ONL) (D–F), and outer retina (ELM-BM) (G–I), derived from the nine experimental animals. Measurements were made for the full field-of-view (left column), as well as both the central (mid-column) and peripheral retinas (right column). The distributions are represented using box and whisker plots and the outliers are plotted outside of the lines. In descending order, the lines in the plots represent: maximum, third quartile, median, first quartile, and minimum. Retinal thinning was observed in both inner and outer layers of the NMDA-injected eyes, with similar severity between central and peripheral retinas. The longitudinal total retinal thickness reduction in the NMDA-injected eye was mainly contributed to by the inner retina. A pairwise t-test was conducted to compare the thickness difference between the NMDA-injected eye and the contralateral control eye at each time point. Multiple comparisons were controlled with a false discovery rate (FDR) = 0.1. The FDR-corrected p-values were shown at the top of each subplot, with the significant p values (< 0.05) shown in red

