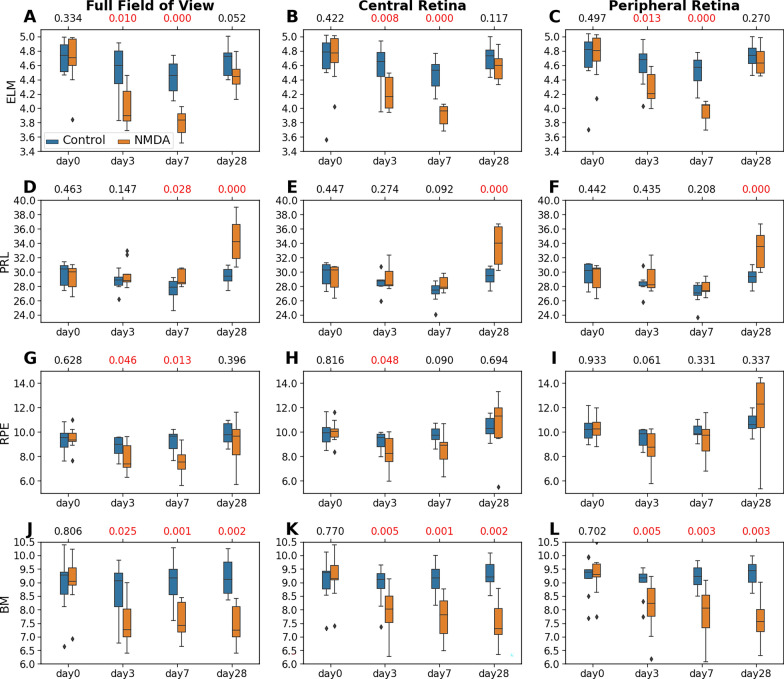
Fig. 7.
Statistical analyses of the thicknesses of the outer retinal layers including ELM (A–C), PRL (D–F), RPE (G–I), and BM (J–L), derived from the nine experimental animals. The distributions are represented using box and whisker plots and the outliers are plotted outside of the lines. Retinal thickness changes were observed in several outer layers of the NMDA-injected eyes, with similar severity between central and peripheral retinas. A pairwise t-test was conducted to compare the thickness difference between the NMDA-injected eye and the contralateral control eye at each time point. Multiple comparisons were controlled with a false discovery rate (FDR) = 0.1. The FDR-corrected p-values were shown at the top of each subplot, with the significant p values (< 0.05) shown in red

