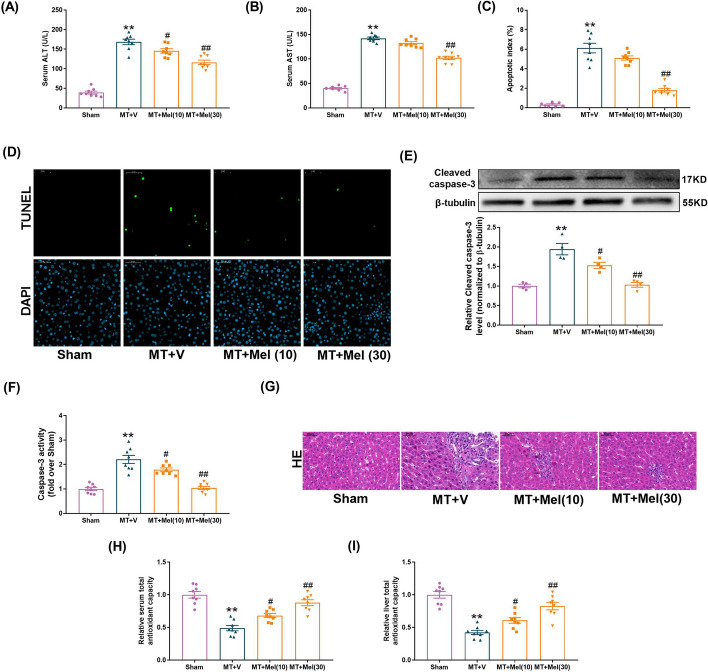
Fig. 2.
Melatonin attenuated MT-induced liver damage and apoptosis in vitro. A The levels of ALT release (fold difference compared with SS). B The levels of AST release (fold difference compared with SS). C Apoptosis index. D Representative TUNEL and DAPI-stained liver sections at × 400 magnification. E Representative blots and quantitative analysis of Cleaved-caspase 3 (n = 4). F Relative activity of caspase 3. G Representative liver HE images. H Total Antioxidant capacity of serum. I Total Antioxidant capacity of liver. All of the values are shown as the means ± SEM. n = 8 in each group. **P < 0.01 vs Sham; #P < 0.05, ##P < 0.01 vs MT + V

