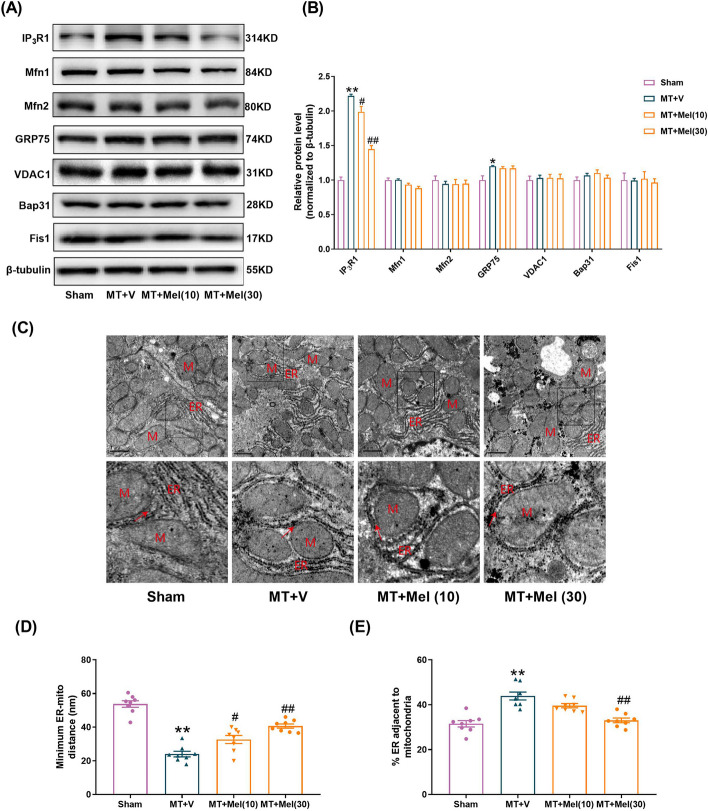
Fig. 3.
Melatonin inhibited IP3R1 elevation and suppressed MAMs formation in the liver following MT. A, B Representative blots and quantitative analysis of representative functional proteins (VDAC1, IP3R1, GRP75), structural proteins (Mfn1, Mfn2) and apoptotic related protein (Bap31, Fis1) of MAMs (n = 4). C Representative TEM images at × 15,000 magnification. Scale bars: 1 μm. D Quantification of the minimum distance between ER and mitochondria. E Quantification of ER length close to mitochondria normalized by total ER length. All of the values are shown as the means ± SEM. n = 8 in each group. *P < 0.05, **P < 0.01 vs Sham; #P < 0.05, ##P < 0.01 vs MT + V

