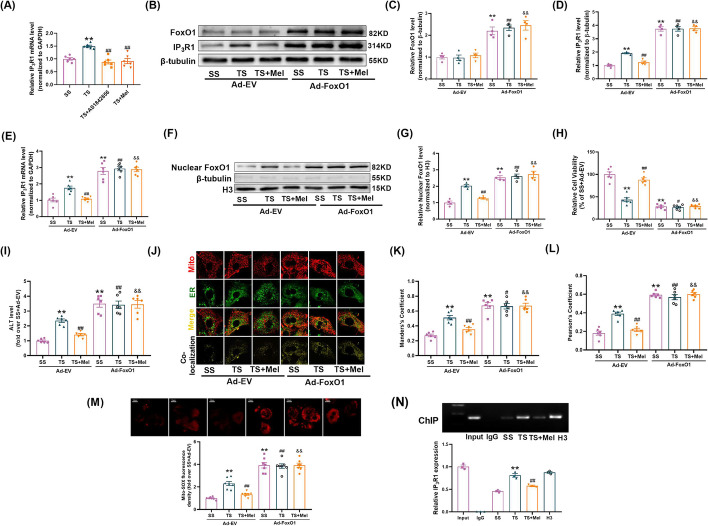
Fig. 8.
Melatonin-ERK1/2 suppressed IP3R1-mediated MAMs via inhibiting FoxO1-mediated transcription. A Quantitative analysis of IP3R1 mRNA expression determined by real-time PCR (AS1842856, a JUNB inhibitor) (n = 6). B–D FoxO1 was overexpressed by adenovirus, after which the cells were subjected to TS or TS + Mel. Representative blots and quantitative analysis of FoxO1 and IP3R1 (n = 4). E Quantitative analysis of IP3R1 mRNA expression determined by real-time PCR. F, G Representative blots and quantitative analysis of nuclear FoxO1 (n = 4). H Cell viability (percentage of SS + Ad-EV). I The levels of ALT release (fold difference compared with SS + Ad-EV). J Representative confocal images of primary hepatocytes double-stained by mitotracker (red) and ER-localized virus (green) at × 600 magnification. K, L Statistical quantification of the colocalization area between mitochondria and ER. M Representative images and quantitative analysis of MitoSOX-stained mitochondria-derived superoxide production. N Chromatin immunoprecipitation (ChIP) and real-time PCR analysis for the binding of FoxO1 to IP3R1 promoter (n = 3). All of the values are shown as the means ± SEM. n = 6 in each group. **P < 0.01 vs SS or SS + Ad-EV; #P < 0.05, ##P < 0.01 vs TS + Ad-EV; &&P < 0.01 vs TS + Mel + Ad-EV

