
Figure 2.
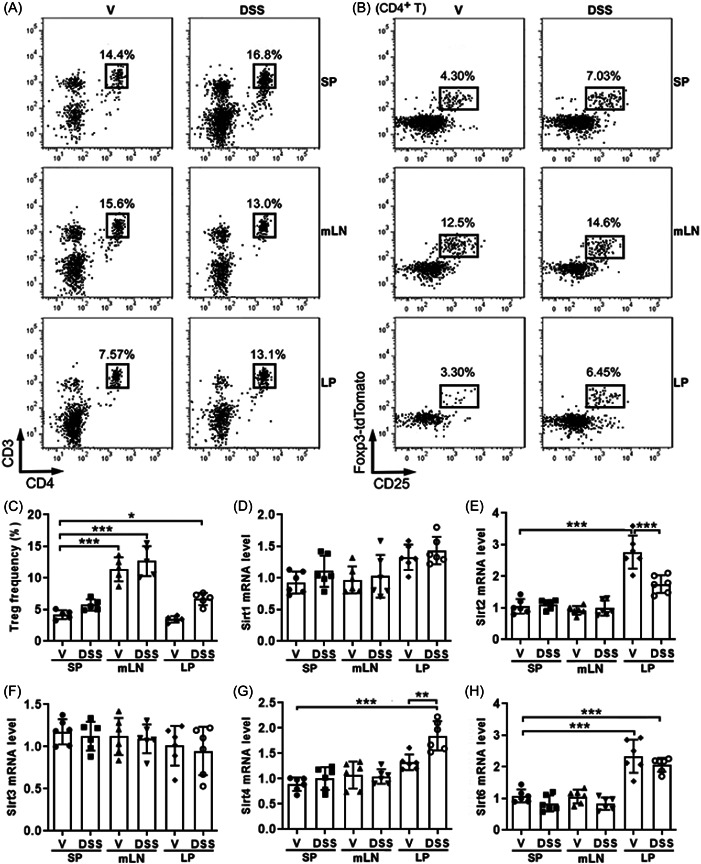
The expression of Sirtuins in regulatory T cells (Tregs). (A) Identification of CD4+ T cells in the spleens (SP), mesenteric lymph nodes (mLN), and lamina propria (LP). (B) Identification of Foxp3‐tdTomato+ Tregs in CD4+ T cells in the SP, mLN, and LP. (C) Frequencies of Foxp3‐tdTomato+ Tregs in CD4+ T cells in indicated tissues. (D–H) messenger RNA levels of indicated Sirtuins in sorted CD4+ tdTomato+ Tregs. N = 6 per group. *p < .05. **p < .01. ***p < .001. One‐way analysis of variance. DSS, dextran sulfate sodium‐treated colitic mice; V, vehicle‐treated mice.