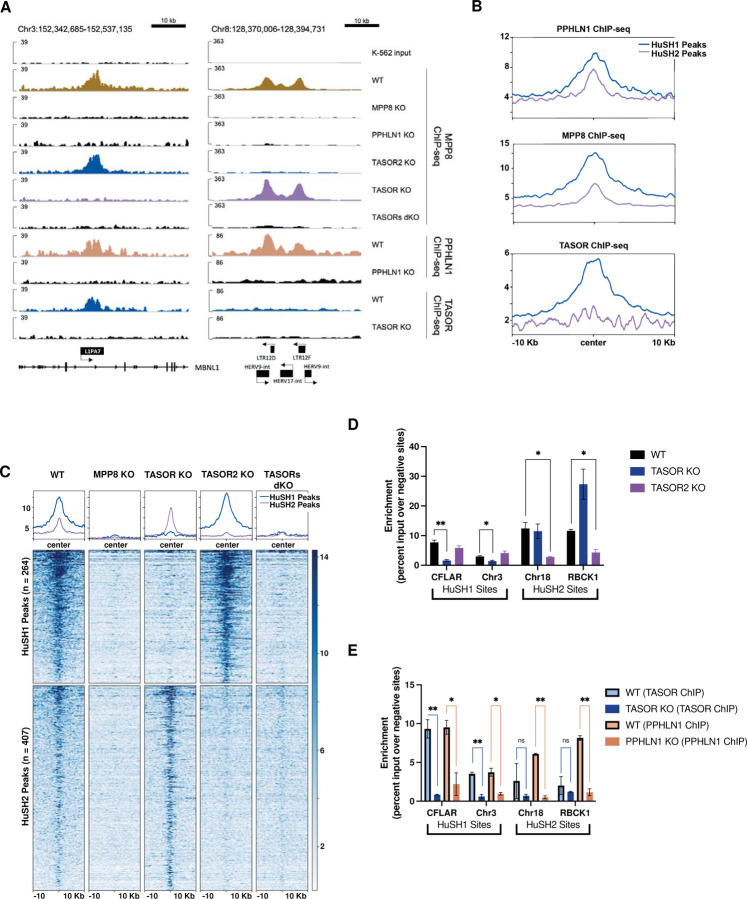
Figure 2: Spatial Distribution and Functional Characterization of HuSH Complexes on the Human Genome.
A) IGV genome browser tracks depict the ChIP-seq profiles of MPP8, PPHLN1, and TASOR in both wild-type (WT) and knockout cell lines. On the left, a representative HuSH site within the L1PA7 element of MBNL1 is highlighted, while the right panel illustrates a HuSH2 site located at LTR elements.
B) Average ChIP-seq profiles for PPHLN1, MPP8, and TASOR across HuSH and HuSH2 sites, generated using Deeptools, revealing distinct localization patterns.
C) Heatmap and peak profiles present MPP8 ChIP-seq results in K-562 cells with knockout backgrounds. Peaks were identified using MACS2 in bio-replicates (n=2) of TASOR knockout and TASOR2 knockout, establishing two nonoverlapping regions, HuSH2 and HuSH sites, respectively.
D) Bar chart displaying MPP8 ChIP-qPCR results with technical replicates (n=2) in knockout cell lines at HuSH and HuSH2 sites. Enrichment is measured as a percentage of input over the average percentage input at negative control sites (GNG and RABL3). Statistical analysis, compared to wild-type MPP8 peak enrichment, indicates significant (*p<0.05) or strongly significant (**p<0.01) results.
E) Bar chart illustrating TASOR (in blue) and PPHLN1 (in peach) ChIP-qPCR outcomes in technical replicates (n=2) of wild-type and knockout cell lines at HuSH and HuSH2 sites. Enrichment is determined as a percentage of input over the average percentage input at negative control sites (GNG and RABL3). Statistical analysis, compared to knockout peak enrichment, reveals significant (*p<0.05) or strongly significant (**p<0.01) results. The data collectively highlight the distinct genomic localization and functional significance of HuSH complexes in regulating specific regions of the human genome.

