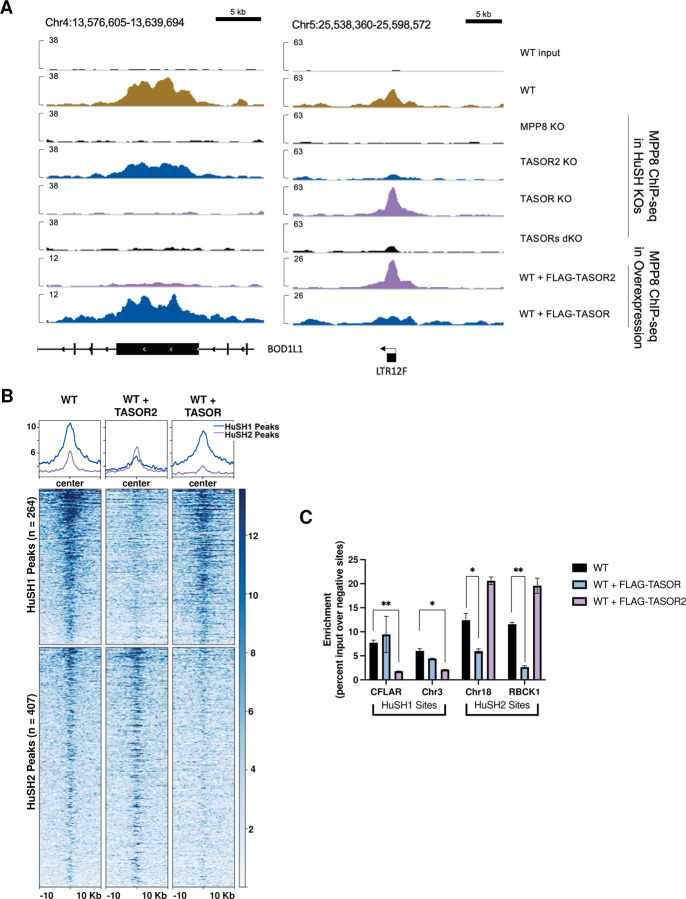
Figure 3: TASOR Overexpression Induces Competition for Limited MPP8 Binding.
A) IGV genome browser tracks illustrate MPP8 ChIP-seq profiles in parental wild-type (WT) cells, knockout cell lines, and cells overexpressing FLAG-TASOR or FLAG-TASOR2. The depicted region includes one HuSH site (left) located within the exon of BOD1L1 and one HuSH2 site (right) situated at an LTR element.
B) Heatmap and peak profiles display MPP8 ChIP-seq results from K-562 cells overexpressing FLAG-TASOR or FLAG-TASOR2. The data is sorted based on dependence on either HuSH or HuSH2.
C) Bar chart presenting MPP8 ChIP-qPCR results from technical replicates (n=2) of FLAG-TASOR or FLAG-TASOR2 overexpressing cell lines at HuSH and HuSH2 sites. The enrichment is measured as a percentage of input over the average percentage input at negative control sites (GNG and RABL3). Statistical analysis, when compared to WT MPP8 peak enrichment, revealed significant (*p<0.05) or strongly significant (**p<0.01) results. These findings suggest a competitive relationship for MPP8 binding sites induced by TASOR overexpression.

