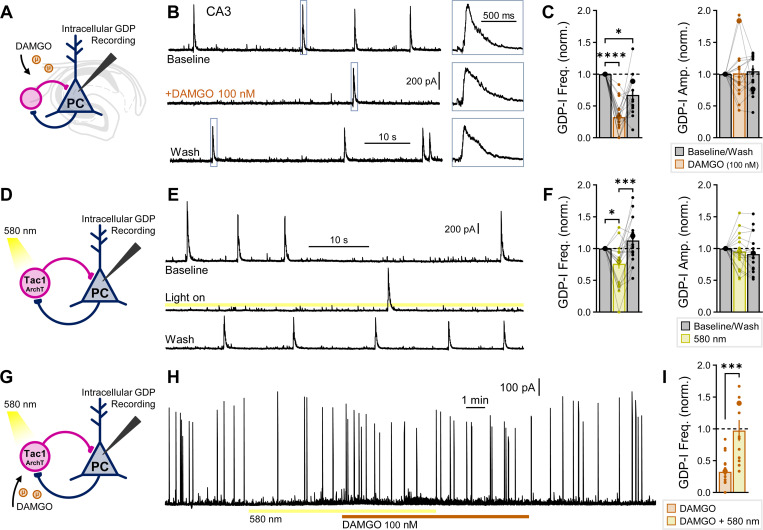
Fig. 7: Opioids and Tac1 cells regulate spontaneous activity of the developing hippocampus.
(A) Schematic of recordings of GDP associated currents (GDP-Is), recorded intracellularly in CA3-PCs voltage-clamped to 0 mV in WT mice. (B) Example traces of the effect of 100 nM DAMGO applied for 5 minutes, with (right inset) example GDP-I events. (C) DAMGO summary data for GDP-I event frequency and amplitude from ncell = 18 from nmice = 6 (P5–8). (D) Schematic of CA3-PC GDP-I recordings from Tac1Cre/+:ArchTfl/+ mice to silence Tac1 cells. (E) Example traces of the effect of ArchT activation with 580 nm light for 1–2 min. (F) ArchT summary data for GDP-I event frequency and amplitude from ncell = 20 from nmice = 6 (P5–8). Asterisks in (C, F) represent Dunn’s post hoc comparisons after a significant effect of treatment was found via Friedman’s test. (G) Schematic of ArchT-DAMGO occlusion in CA3-PCs. (H) Example trace of the effect of Tac1-ArchT silencing for 10 min., with 100 nM DAMGO applied 5 min. after start of Tac1-ArchT silencing. (I) ArchT-DAMGO occlusion summary data from ncell = 13 from nmice = 4 (P6–8). DAMGO administration following Tac1-AchT silencing did not further suppress GDP-I event frequency (yellow). DAMGO alone (orange) plotted from C for comparison. Asterisks represent results of unpaired t-test.

