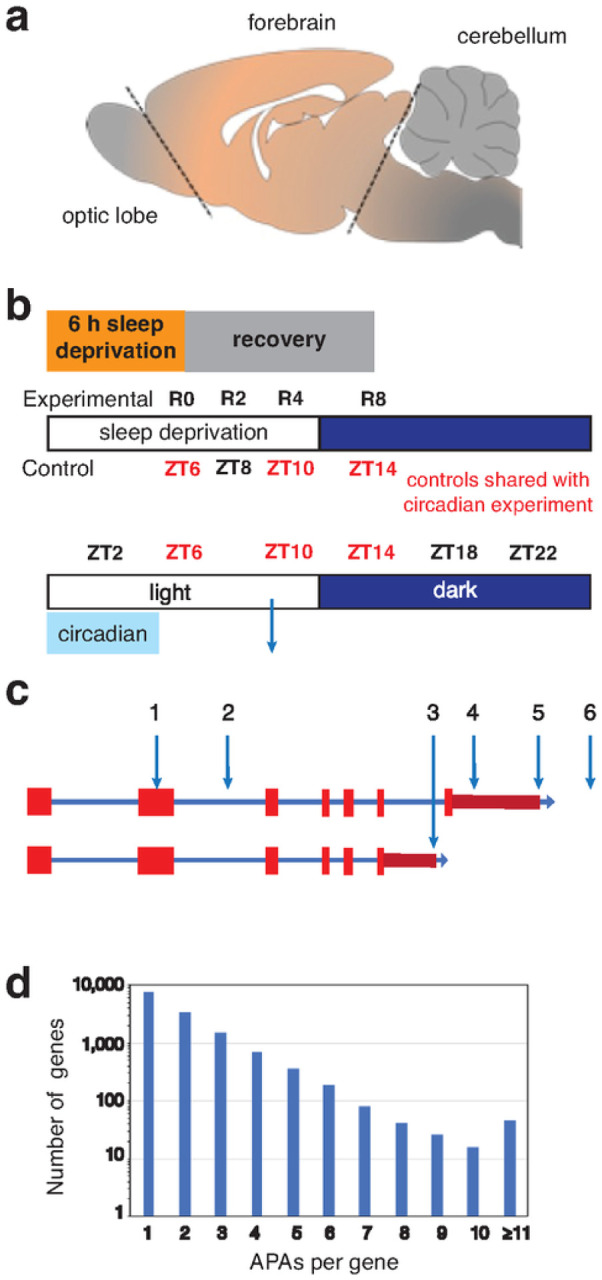
Figure 1.

Schema of the brain region sampled, the collection time/condition, and a plot of the number of APA sites per gene. (a) The region of the central rat forebrain that was collected and used for RNA extraction is labeled ‘forebrain’. (b) For sleep homeostasis experiments, rats were sleep-deprived for 6 h and allowed to recover for 0 to 8 h before tissue extraction. Three of the time-matched controls (no SD) were shared with the circadian experiment and one additional time point (no SD at ZT8), was not in common. For the circadian analysis, samples were taken at 4 h intervals from ZT2 until ZT22. Five biological replicates were used for all data points. (c) A diagram of a generic gene shows different types of APAs: within an internal exon (1); within an early intron (2); following an internal exon (3); within the longest documented 3’ UTR (4); at the terminus of the longest documented 3’ UTR (5); and distal to longest documented 3’ UTR. (d) WTTS-seq PAS results; the number of genes on the x-axis (log10 scale) are plotted against the number of APA sites per gene.
