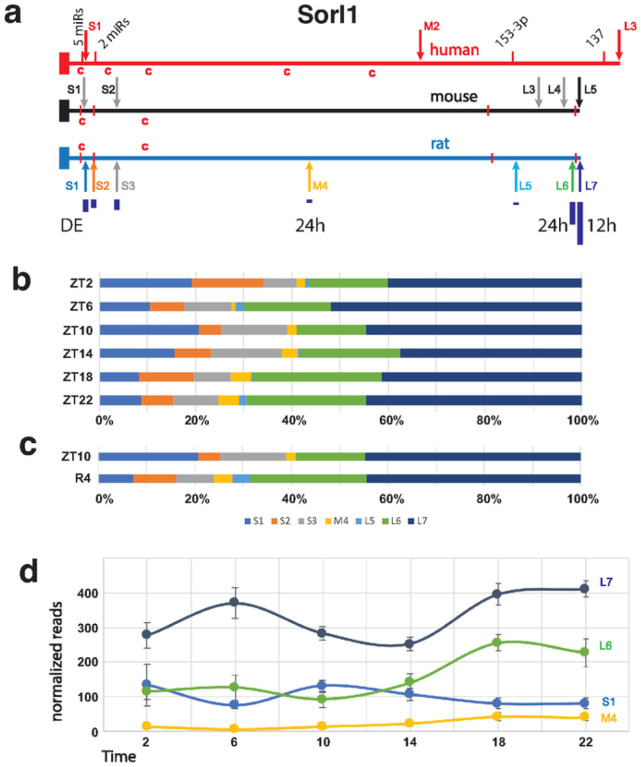
Figure 4.
Map and APA read analyses of Sorl1. (a) Maps of the human, mouse and rat Sorl1 gene 3’ UTRs show APA sites indicated by arrows. Four highly conserved miR binding sites are marked by red bars in all three species. The first 2 are recognized by multiple miRs. The size of dark blue bars under the rat APAs depict the individual proportion compared to the total of all WTTS Sorl1 reads. The human APAs are from established isoforms which also include different exon configurations. The first 4 mouse APAs are suggested by ESTs, and, in the latter 3 cases, by upstream polyA signals and PolyA_DB v3 data. Red ‘c’s indicate matches to the consensus CPE sites. (b) The proportion each Sorl1 APA contributes to the total for the gene are plotted for each of the circadian timepoints. (c) The proportion each Sorl1 APA contributes to the total for the gene are plotted for the differentially expressed samples: ZT10 and 4 hours after SD. (d)Graph of normalized read numbers of 4 Sorl1 APAs that either cycle with 24 h (M4 and L6) or 12 h (L7) hours and the one differentially expressed after SD (S1).

