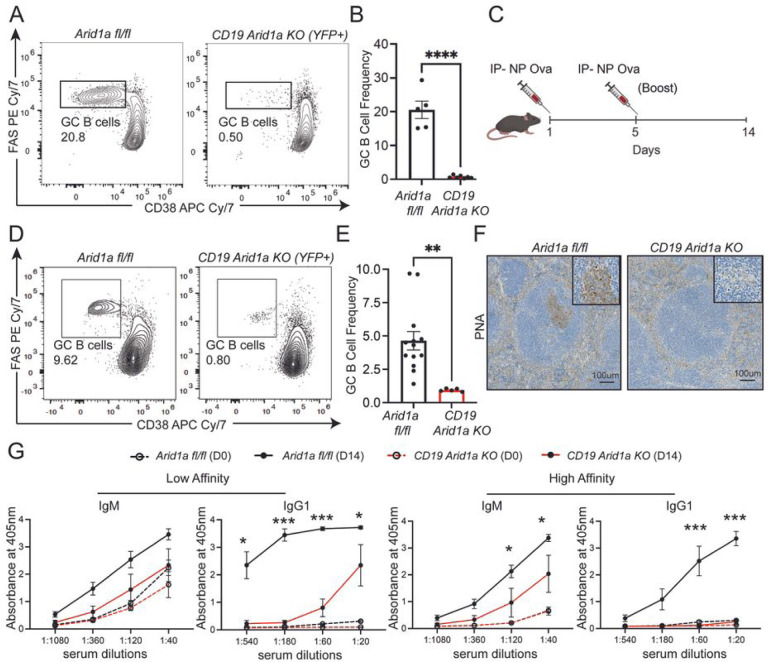
Figure 1. Arid1a deficiency in B cells perturbs germinal center B cell responses.
A Representative flow cytometry analysis of GC B cells gated on B cells from Peyer’s Patches of Arid1a fl/fl and CD19 Arid1a KO mice. Numbers represent frequency of GC B cells, identified as FAS+ (y axis) and CD38low/- (x axis). B. Quantification of GC B cell frequency in Peyer’s Patches of Arid1a fl/fl(YFP-; n=5) and CD19 Arid1a KO (YFP+; n=7). C. Schematic for immunization with alum adjuvanted NP-Ova for Arid1a fl/fl and CD19 Arid1a KO mice. D. Representative flow cytometry analysis of splenic GC B cells gated on B cells from NP-Ova immunized Arid1a fl/fl and CD19 Arid1a KO mice at 14 days post-immunization. Numbers represent frequency of GC B cells. E. Quantification of GC B cell frequency in spleen of Arid1a fl/fl (YFP-; n=13) and CD19 Arid1a KO (YFP+; n=5). F.Representative immunohistochemistry images for PNA staining on formalin fixed spleen sections from Arid1a fl/fl and CD19 Arid1a KO mice immunized with NP-Ova at 14 days post immunization. G. Quantification of ELISA for detection of NP-specific low affinity (using NP-36) and high affinity (using NP-2) IgM and IgG 1 antibodies in the sera of NP-Ova immunized Arid1a fl/fl (n=3) and CD19 Arid1a KO (n=3). The serum antibodies were measured with 3-fold serial dilutions. Sera were collected prior to immunization Day 0 (DO) and at 14 days post-immunization (D14). Statistical significance is calculated using two-tailed Student’s t-test for B and E, multiple unpaired t-tests for G. Error bars represent mean ± standard error (s.e).; *p value < 0.05; **p value < 0.01; ***p value ≤ 0.0005; ****p value < 0.0001.

