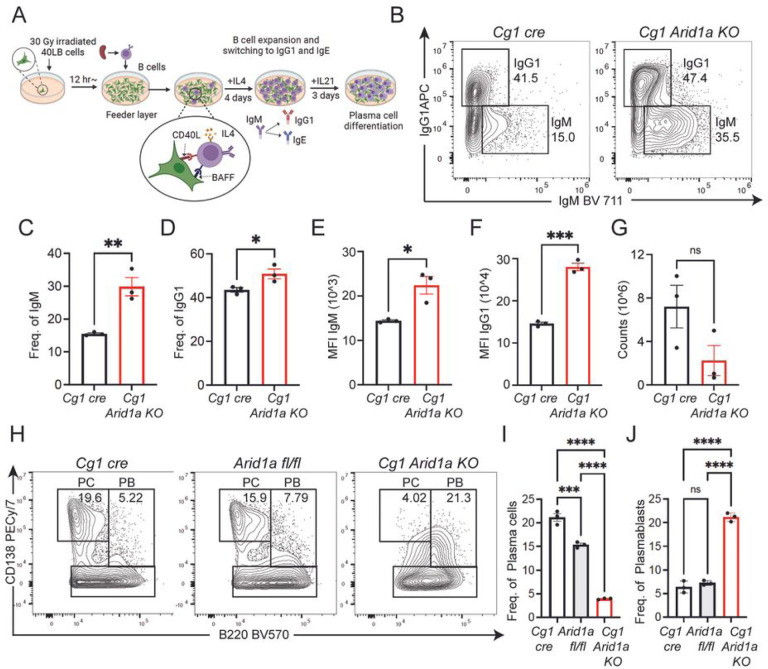
Figure 3. Arid1a-deficient B cells undergo activation in vitro.
A. Schematic representation of the 40LB co-culture system for in vitro B cell stimulation. B. Representative flow cytometry analysis of IgG1 and IgM gated on B cells (Cg1 cre and Cg1 Arid1aKO) at day4 of 40LB co-cultures with IL4 (1ng/ml). C and D.Quantification of IgM and IgG1 frequencies at day 4 of 40LB co-culture. E and F. Median fluorescence intensity (MFI) of IgM and IgG1 ecll surface expression at day 4 of 40LB co-cultures. G. Cell counts of B cells from Cg1cre and Cg1 Arid1aKO co-cultured on 40LB cells for four days. H. Representative flow cytometry analysis of plasma cell (B220 low CD138 high) and plasmablast (B220+ CD138 intermediate) populations on 40LB co-cultures supplemented with IL21(10ng/ml) for 3 additional days after the initial 4-day co-culture in presence of IL4. I. Quantification of plasma cells and plasmablasts from Arid1a fl/fl, Cg1 cre and Cg1 Arid1a KO activated B cells (n=3). Statistical significance is calculated using two-tailed Student’s t-test for C-G, and one-way ANOVA for I and J. Error bars represent mean ± s.e.; *p value ≤ 0.05; **p value ≤ 0.01; ***p value ≤ 0.0005; ****p value < 0.0001.

