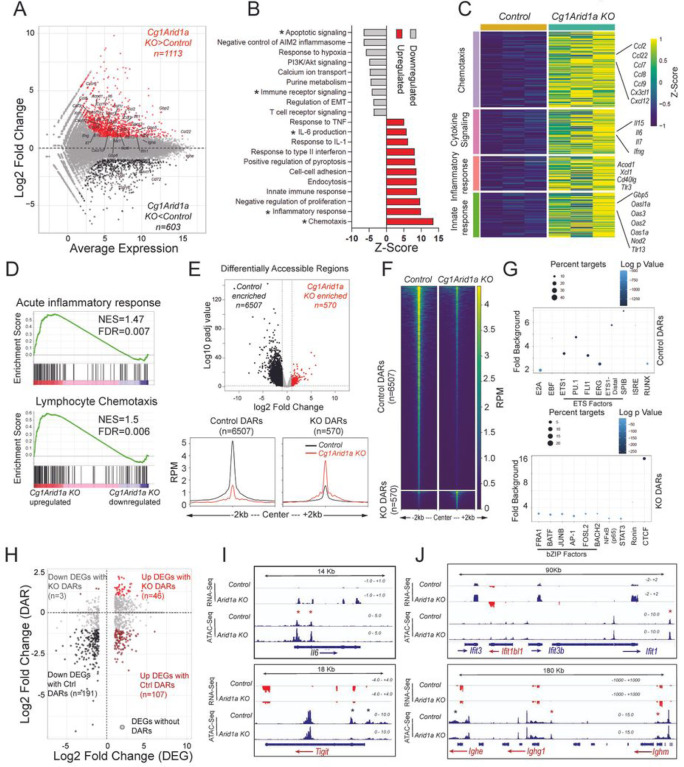
Figure 4. Arid1a deficiency is associated with induction of inflammatory signatures.
A. MA plot of RNA-sequencing data displaying changes in gene expression in Cg1 Arid1a KO cells compared to control B cells. The highlighted genes (Red: upregulated, Black: downregulated) are differentially expressed genes. B. Upregulated (red) and downregulated (grey) pathways in Cg1 Arid1a KO compared to control B cells. The x-axis represents the Z-score, and asterisks highlight relevant pathways from Metascape analysis. C. Heatmap of gene expression data for Cg1 Arid1a KO and control B cells from chemotaxis, cytokine signaling, inflammatory response and innate response genes pathways. The color palette represents the Z-score from transcripts per million (TPM) values. D. Gene set enrichment analysis (GSEA) plots for the transcriptional profile of Cg1 Arid1a KO and control B cells, using gene sets from Acute inflammatory response (top) and Lymphocyte chemotaxis (bottom) pathways. Y-axis denotes enrichment score. NES, Normalized enrichment score, FDR, False discovery rate. E. Top, Volcano plot (top) of ATAC-seq data displaying differentially accessible regions (DARs) in Cg1 Arid1a KO compared to control B cells. Bottom, profile histograms showing the mean ATAC-seq signal in 6507 control and 570 KO enriched DARs (control B cell signal, black; Cg1 Arid1aKO Signal, red). F. Heatmap showing enrichment of ATAC-seq (average of 3 replicates) in Cg1 Arid1a KO and control B cells. Reads per million (RPM) values in DARs are plotted in +/− 2 kb windows from the center of the peak. G. Motif enrichment analysis of control DARs (top) and KO DARs (bottom). The y-axis indicates the fold enrichment over background, circle size indicates the percentage of regions with the respective motif, and the color indicates the significance (log10 P value). H. Scatter plot of log2 fold change DARs (y-axis) and gene expression changes (x-axis) between Cg1 Arid1aKO and control B cells. DEGs associated with a DAR are denoted in color (black: downregulated; red: upregulated in Cg1 Arid1aKO). I. Genome browser views of RNA-seq and ATAC-seq data showing gene expression and accessibility changes in 116 (top) and Tigit (bottom) loci. J. Genome browser view of RNA-seq and ATAC-seq data at Ifit (top) and Igh (bottom) loci. Asterisks denote changes in accessibility (red and black asterisks denote increased and decreased accessibility signals in Cg1 Arid1a KO cells, respectively). Please see bioinformatics analysis in methods for additional information.

