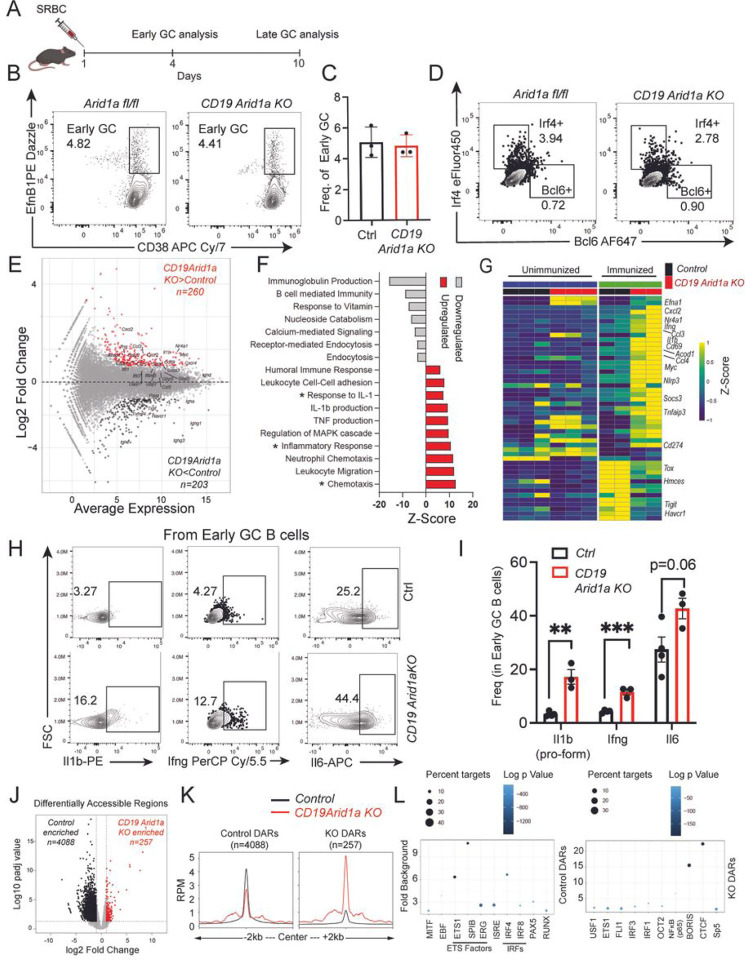
Figure 5. Arid1a-deficient B cells fail to sustain GCs.
A. Schematic for immunization with SRBC for Arid1a fl/fl and CD19 Arid1a KO for early (day 4) and late GC (day 10) analysis. B. Representative flow cytometry analysis of early GC B cells (EfnB1+CD38+) gated on splenic B cells from SRBC immunized Arid1a fl/fl and CD19 Arid1aKO mice at day 4 post-immunization. C. Quantification of early GC B cell frequency in spleen of Arid1a fl/fl (YFP-) and CD19 Arid1a KO (YFP+) mice at day 4 post-immunization. D. Representative flow cytometry plots for Irf4 and Bcl6 gated on splenic B cells from day 4 SRBC immunized Arid1a fl/fl and CD19 Arid1aKO mice. E. MA plot of RNA-sequencing data displaying changes in gene expression in CD19 Arid1aKO B cells compared to control B cells. The highlighted genes (Red: upregulated, Black: downregulated) are differentially expressed genes. F. Upregulated (red) and downregulated (grey) pathways in CD 19 Arid1aKO compared to control B cells. The x-axis represents the Z-score, and asterisks highlight relevant pathways from Metascape analysis. G. Heatmap of gene expression data for CD19 Arid1a KO and control early GC B cells and B cells from a subset of differentially expressed genes with or without immunization. The color palette represents the Z-score from the TPM values. H. Representative flow cytometry analysis of Il1 b (pro-form), Ifng and Il6 in Control (Ctrl) (YFP-) and CD19 Arid1aKO (YFP+) early GC B cells (EfnB1 +CD38+) in spleen at day 4 following SRBC immunization. I. Quantification of Control (Ctrl) (YFP-) and CD19 Arid1aKO (YFP+) early GC B cell frequency for expression of Il1b (pro-form), Ifng and Il6 proteins at day 4 post-immunization. J. Volcano plot (top) of ATAC-seq data displaying differentially accessible regions (DARs) in CD19 Arid1a KO compared to control early GC B cells. K. Profile histograms showing the mean ATAC-seq signal in 6507 control and 570 KO enriched DARs (control B cell signal, black; CD19 Arid1aKO signal, red). L. Motif enrichment analysis of control DARs (top) and KO DARs (bottom) from CD19 Arid1a KO and control early GC B cells. The y-axis indicates the fold enrichment over background, circle size indicates the percentage of regions with the respective motif, and the color indicates the significance (log10 P value). Statistical significance is calculated using two-tailed Student’s t-test for C and L. Error bars represent mean ± s.e.; *p value ≤ 0.05; **p value ≤ 0.01; ***p value ≤ 0.0005; ****p value < 0.0001. Please see bioinformatics analysis in methods for additional information.

