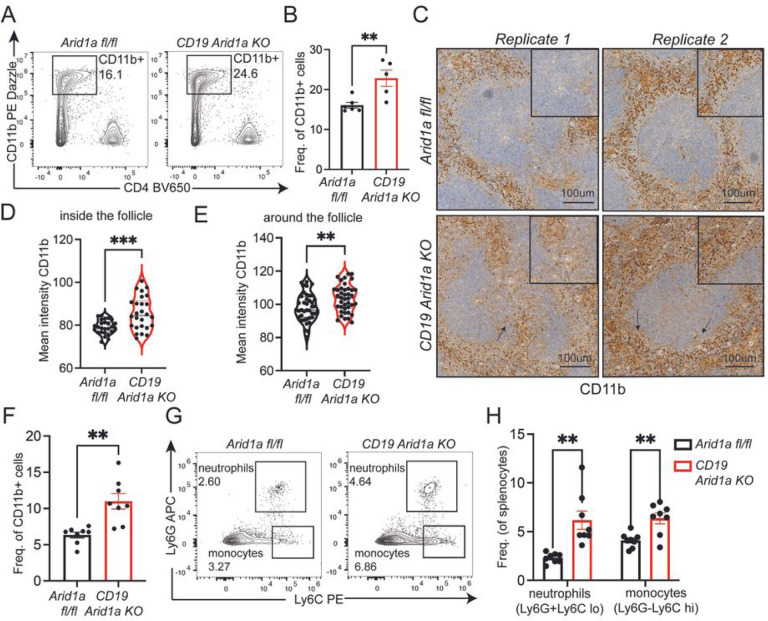
Figure 6. Arid1a deficiency in B cells promotes infiltration of inflammatory myeloid cells.
A. Representative flow cytometry analysis of splenic CD11b+ myeloid cells from NP-Ova immunized Arid1a fl/fl and CD19 Arid1aKO mice at day 14 post-immunization. B.Quantification of CD11b+ myeloid cells frequency in spleen of Arid1a fl/fl and CD19 Arid1a KO mice at day 14 post-immunization. C.Representative immunohistochemistry images for CD11b staining on formalin fixed spleen sections from Arid1a fl/fl and CD19 Arid1a KO mice immunized with NP-Ova at day 14 post immunization. Magnified inlet from replicate 1 (both Arid1a fl/fl and CD19 Arid1a KO, left panels) shows CD11b staining inside the B cell follicles. The magnified inlet from replicate 2 (right panels) shows CD11b staining around the B cell follicles. D-E. Violin plot quantifying the mean intensities of CD11b staining using Image J software for both inside (D) and around (E) the follicle. F. Quantification of CD11b+ myeloid cell frequency by flow cytometry in spleen of Arid1a fl/fl and CD19 Arid1a KO mice at day 4 post-immunization. G. Representative flow cytometry plots showing neutrophils (Ly6G+Ly6C lo) and inflammatory monocytes (Ly6G-Ly6C hi) from day 4 SRBC immunized Arid1a fl/fl and CD19 Arid1aKOspleens. H. Quantification of neutrophils (Ly6G+Ly6C lo) and inflammatory monocytes (Ly6G-Ly6C hi) from Arid1a fl/fl and CD19 Arid1aKO mice at day 4 post-immunization. Statistical significance is calculated using two-tailed Student’s t-test for B, and D-F, multiple unpaired t-tests for H. Error bars represent mean ± s.e.; *p value ≤ 0.05; **p value ≤ 0.01; ***p value ≤ 0.0005; ****p value < 0.0001.

