Figure 1.

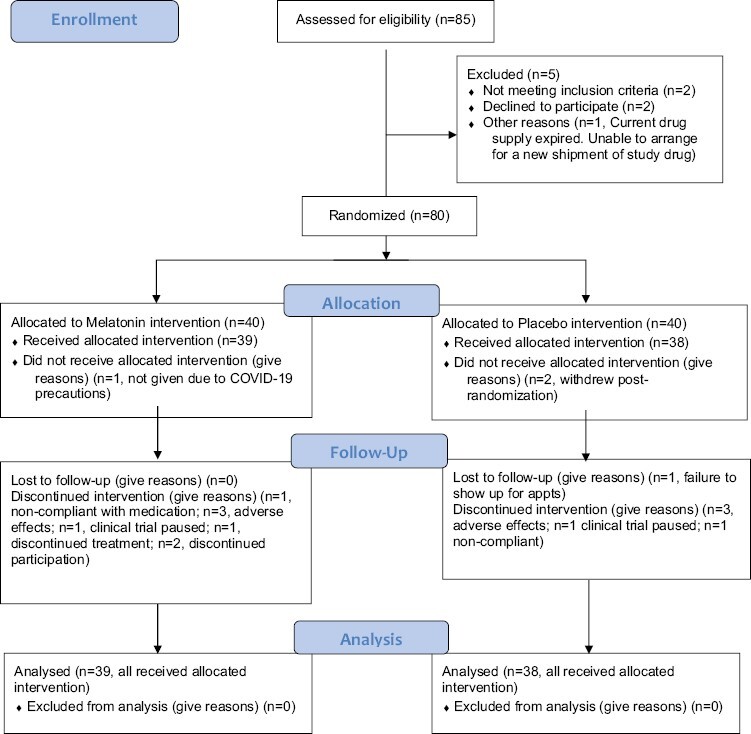
The CONSORT diagram displays the flow of patients through different stages of the study; 77 patients were included in the final analysis.

The CONSORT diagram displays the flow of patients through different stages of the study; 77 patients were included in the final analysis.