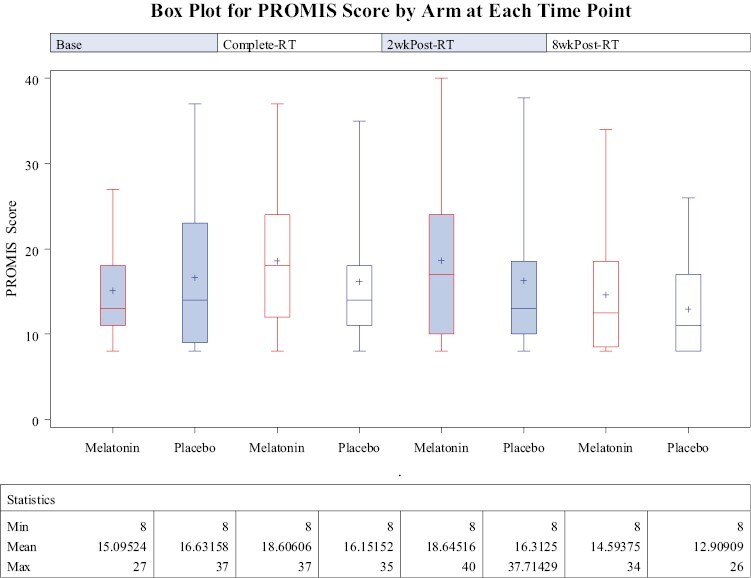
Figure 3.

Box plot for PROMIS scores of patients enrolled in the melatonin and placebo groups is shown at each time point (baseline, completion of RT, 2 weeks post-RT, and 8 weeks post-RT). Higher scores indicate increased fatigue and therefore reduced QOL. The treatment effect as measured by the treatment by time interaction was not found to be statistically significant (P-value is .34).
