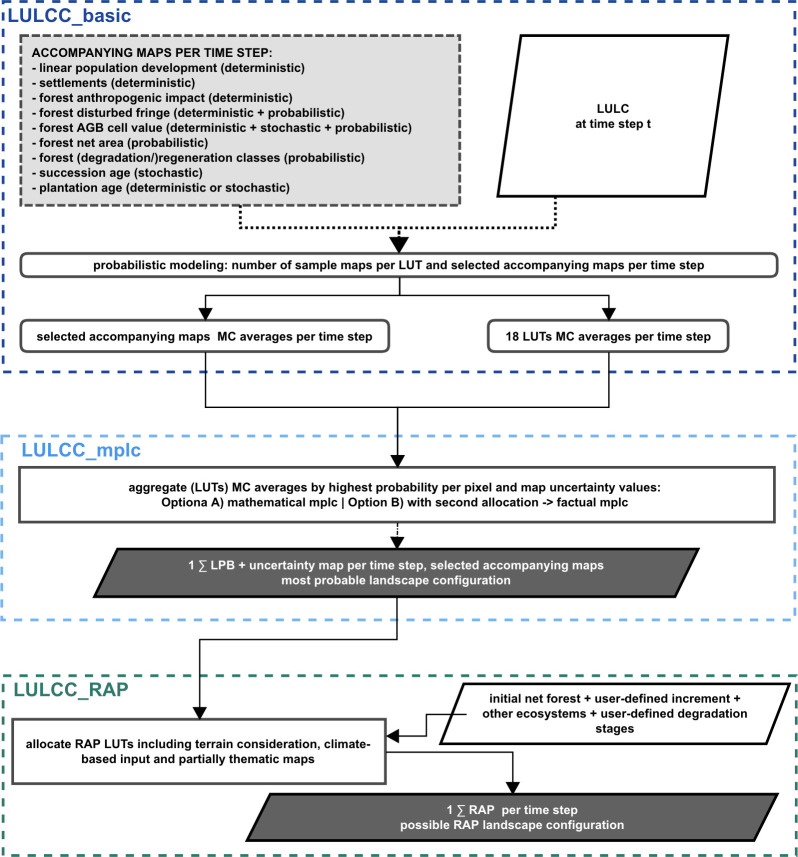
Fig 1. LPB-RAP model flowchart.
The LPB-RAP model flowchart depicts the major simulation steps and outputs within the user-defined baseline and guideline scenario setting. The basis of the new model design is the aggregation and re-interpretation of probabilistically simulated datasets of the general landscape (LULCC LUTs Monte Carlo averages) and selected thematic aspects (accompanying maps). The three main modules (LULCC_basic, LULCC_mplc, LULCC_RAP) are executed consecutively, i.e., each module simulates all time steps (and in LULCC_basic all samples) before the next module is applied. For details regarding the allocations in modules LULCC_basic, LULCC_mplc and LULCC_RAP, see Figs 2 to 4.

