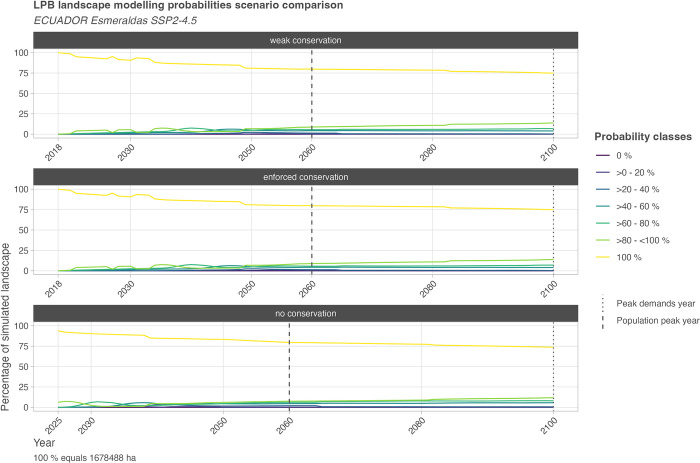
Fig 5. Landscape modeling probabilities classified numerical depiction for the entire simulation time frame.
The diagram depicts the classified probabilities in LULCC_mplc, here following the corrective allocation to the factual mplc, i.e., for particular pixels, smaller probabilities than derived from the mathematical mplc can be in place. The class 0% does not occur; it is only implemented to track potential simulation errors. Otherwise, the distribution of probability classes is related to the chosen number of samples; here, the pseudo-random sampling approach was chosen, resulting in 49 samples for the Esmeraldas region. Further uncertainty elements are the stochastically based simulations of plantations and succession besides the development of previously unused areas. For an example visualization of the spatial distribution of uncertainty for a selected probing date, see Fig 6; for all probing dates of the three guideline scenarios marked on the x-axis see section 1.1.2 in S4 File; for discrete numeric values in annual resolution see S5 File.

