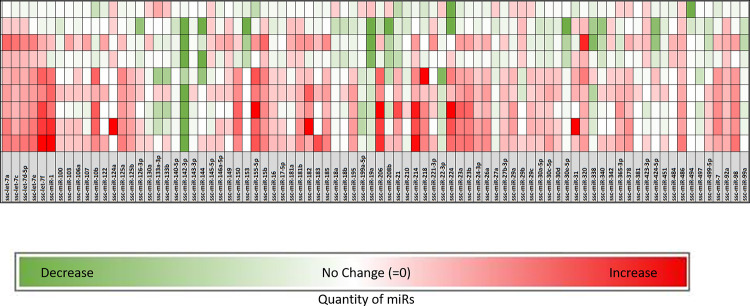
Fig 2. A heat map was generated for all the miRs utilized in the array, as a function of a fold change from referent control values.
The rows represent individual pig values following the exercise protocol. A number of miRs changed as a function of exercise within the LV myocardium and were selected for further analysis as indicated in Table 2.

