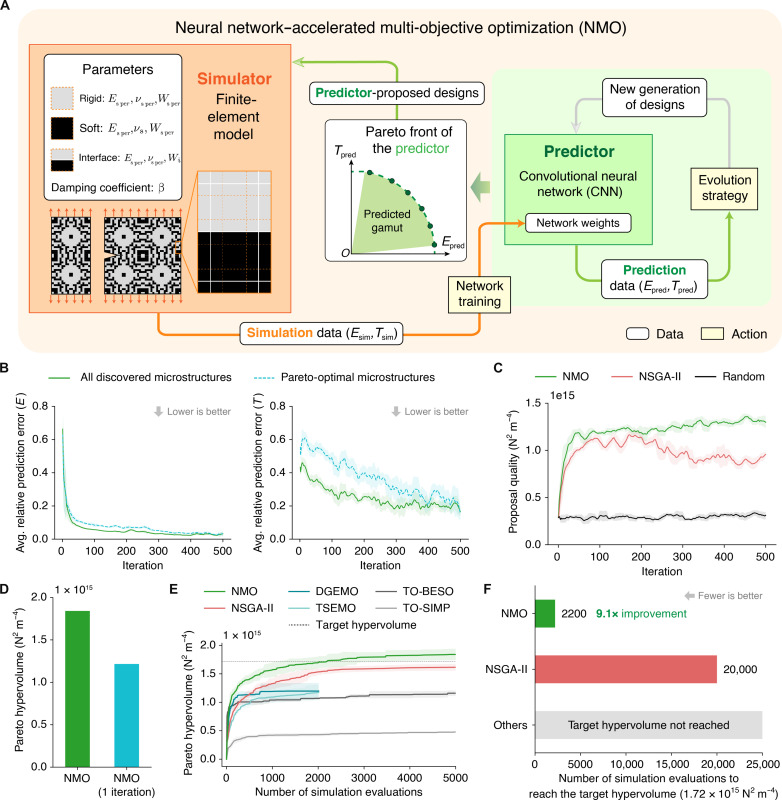
Fig. 2. The inner loop of the proposed workflow with neural network-accelerated multi-objective optimization (NMO).
(A) Workflow of NMO, illustrated by a zoomed-in snapshot of Fig. 1A. The simulator has 10 exposed parameters, including material model parameters of rigid, soft, and interface base materials plus a global damping coefficient. (B) Average prediction errors of Young’s modulus and toughness in NMO over 500 iterations, calculated for all discovered microstructures and specifically those on the simulation Pareto front. Shaded regions indicate SDs estimated from adjacent data points. (C) Evolution of design proposal quality, as characterized by the Pareto hypervolume of 10 proposed designs in each iteration, over 500 iterations. NMO is compared with NSGA-II and a random sampling strategy. (D) Comparison of the final Pareto hypervolumes from NMO and its simplified alternative (NMO one iteration) that only trains the predictor with 5000 random designs and proposes designs back to the simulator once. (E) Comparison between NMO and other multi-objective optimization algorithms in Pareto hypervolume growth within a budget of 5000 simulation evaluations. The baselines comprise our modified NSGA-II algorithm, topology optimization (TO) [e.g., BESO (27, 57) and SIMP (58)], and multi-objective Bayesian optimization (MOBO) [e.g., diversity-guided efficient multiobjective optimization (DGEMO) (29) and Thompson sampling efficient multiobjective optimization (TSEMO) (30)]. MOBO algorithms are stopped at 2000 simulations due to exceeding a time limit of 24 hours. Each solid curve is an average of repeats using five random seeds, and the colored region around each curve indicates SD. (F) Number of evaluations required for NMO and other baseline algorithms to reach a target hypervolume, marked by the dashed black line in (E).

