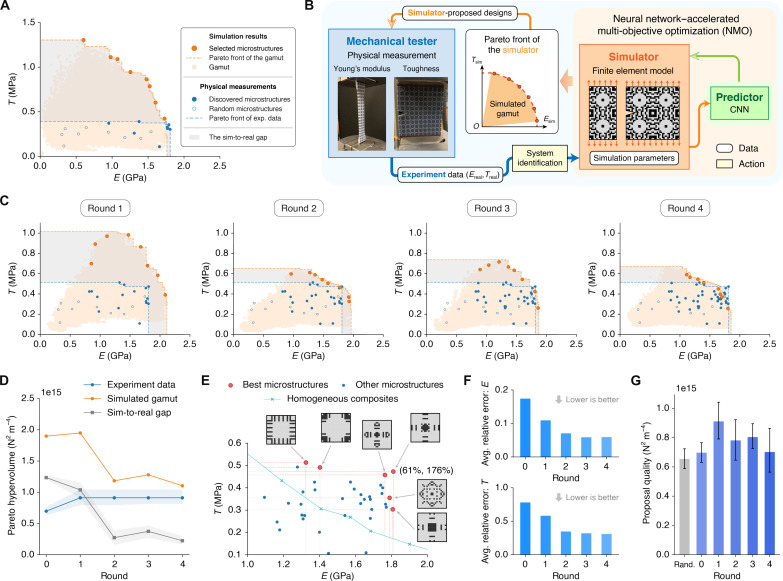
Fig. 3. The outer loop of the proposed workflow.
(A) Experiment data of discovered microstructures and the simulation gamut at the end of round 0. The sim-to-real gap is defined as the symmetric difference between the Pareto hypervolumes of the experimental Pareto front and the simulation Pareto front. (B) Workflow illustration of the outer loop as simplified from Fig. 1A. (C) Evolution of experiment data and the simulation gamut within four rounds of the outer loop, where the sim-to-real gap shrinks substantially. (D) Pareto hypervolume of experiment data and the simulation gamut, and the area of the sim-to-real gap over four rounds of the outer loop. (E) Representative microstructures found by the pipeline with optimal trade-offs. Numbers in parentheses indicate the improvement of a design in Young’s modulus and toughness compared to homogeneous composites with various volume fractions of the rigid material. (F) Average relative simulation error on Young’s modulus and toughness in each round of the outer loop. The error is calculated for all 50 discovered microstructures to showcase the improvement in simulation accuracy. (G) Quality of microstructure designs proposed by the simulator over the entire outer loop. Proposal quality is evaluated by the experimental Pareto hypervolume of eight proposed designs in each round. The quality of the 10 randomly chosen microstructures before round 1 (Rand.) is used as a reference.

