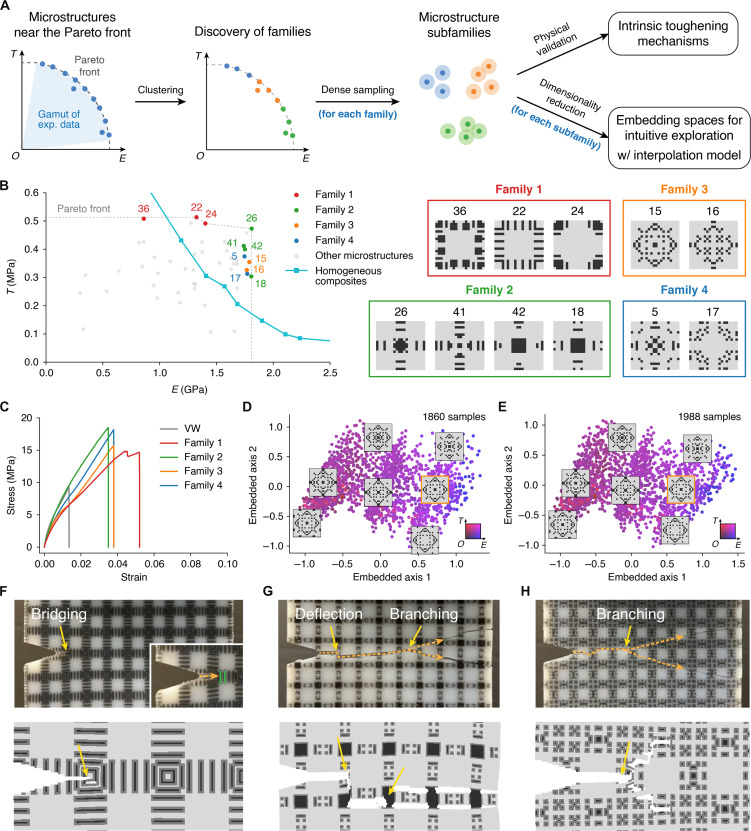
Fig. 4. Analysis of families and intrinsic toughening mechanisms using discovered Pareto-optimal microstructures.
(A) Schematic of the analysis workflow. Microstructures near the Pareto front are grouped into families and further split into subfamilies (see note S4 and fig. S17). The mechanical performance of each family is verified, while the pattern variation in each subfamily is studied in a low-dimensional embedding space. (B) Seed microstructures of four families and their mechanical performance compared with homogeneous composites. (C) Representative stress-strain curves of microstructures in each family collected from mechanical testing. (D and E) Isomap embedding space of an example subfamily before (D) and after (E) interpolation. Some representative patterns are illustrated. Microstructure properties are encoded in colors (Young’s modulus: the blue channel; toughness: the red channel). Seed patterns are highlighted in orange boxes. (F to H) Toughening mechanisms observed in experiment and simulation: bridging, deflection, and branching. Snapshots are taken from validation microstructures in family 1 (F), family 2 (G), and family 3 (H).

