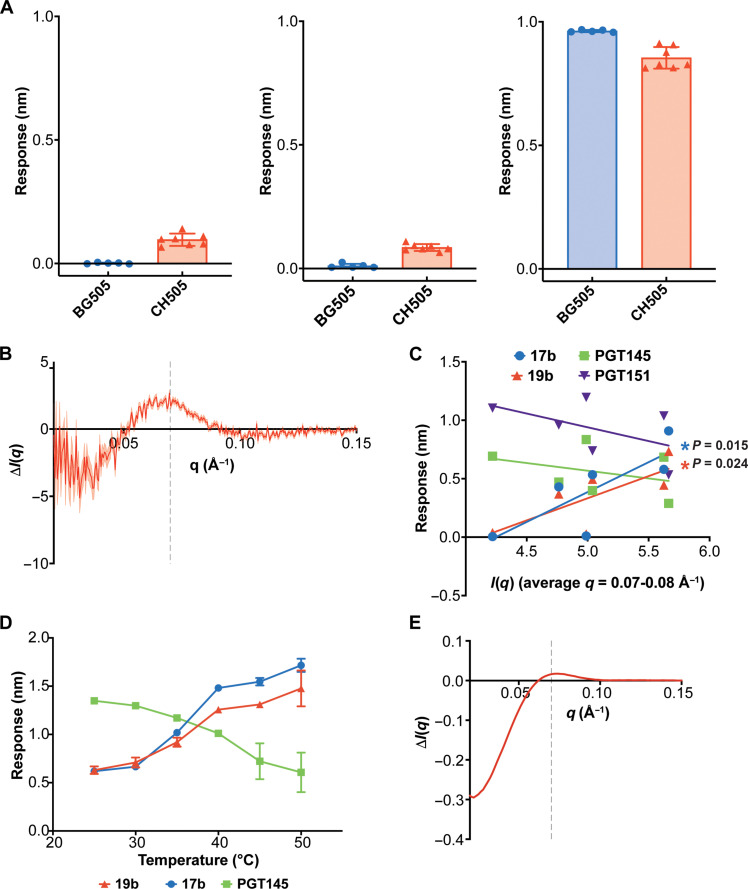
Fig. 2. Static SAXS profiles capture HIV-1 Env conformation.
(A) BLI binding responses for 17b (left), 19b (middle), and PGT145 (right) for BG505 SOSIP (blue circles) and CH505 SOSIP (red triangles). Error bars indicate the SD from the arithmetic mean aggregated from five and seven independently produced BG505 and CH505 SOSIP lots, respectively. (B) Static SAXS scattering difference curve representing the intensity differences between the BG505 and CH505 curves. Propagated SE represented by the shaded region. The scattering difference feature (q) peak at ~0.07 Å−1 is indicated by the gray dashed line. (C) SAXS scattering intensity averages between 0.07 and 0.08 Å−1 versus BLI binding responses for 17b (blue circles), 19b (red triangles), PGT145 (green squares), and PGT151, (purple inverted triangles) determined for a panel of SOSIP Envs. (D) CH505 Env SOSIP temperature series binding responses for interactions with 17b (blue circles), 19b (red triangles), and PGT145 (green squares). The error bars indicate the SD from the arithmetic mean (N = 3). (E) SAXS scattering difference curves calculated by subtracting the CH505 Env SOSIP SAXS scattering profile at 25°C from the CH505 Env SOSIP scattering profile at 50°C. The scattering difference feature peak is indicated at q = 0.07 Å−1 by the gray dashed line.

