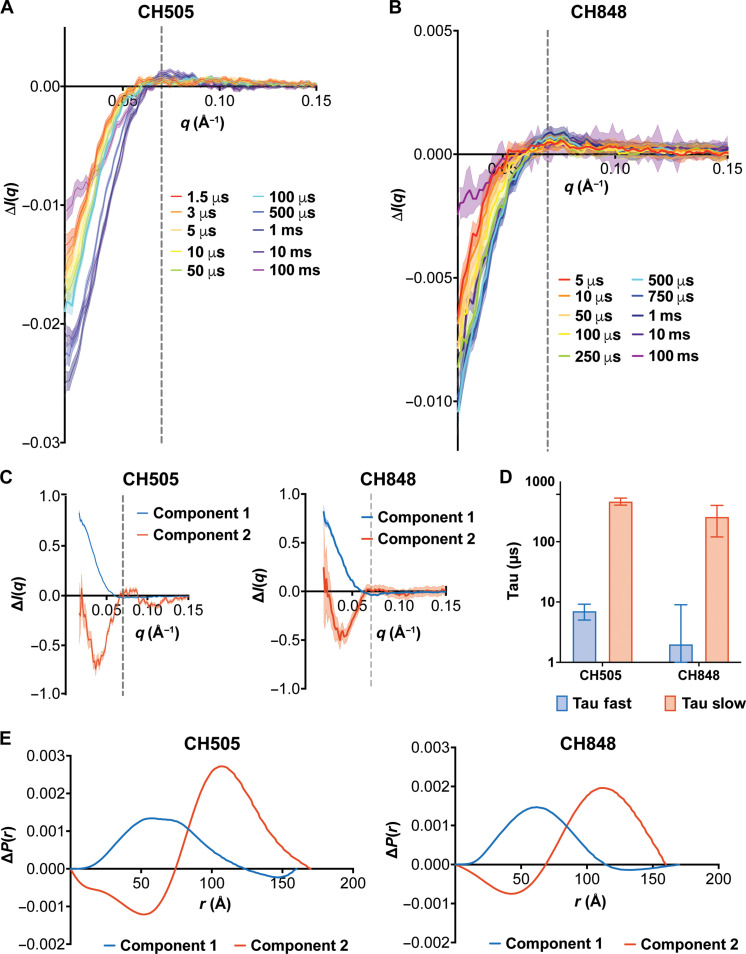
Fig. 3. TR, T-Jump SAXS of HIV-1 Env reveals two structural transitions.
(A) CH505 Env SOSIP TR, T-Jump SAXS scattering difference curves for 1.5-μs (red), 3-μs (orange), 5-μs (light orange), 10-μs (yellow), 50-μs (green), 100-μs (cyan), 500-μs (blue), 1-ms (indigo), 10-ms (violet), and 100-ms (magenta) time delays. (B) CH848 SOSIP Env TR, T-Jump SAXS scattering difference curves for 5-μs (red), 10-μs (orange), 50-μs (light orange), 100-μs (yellow), 250-μs (green), 500-μs (cyan), 750-μs (blue), 1-ms (indigo), 10-ms (violet), and 100-ms (magenta) time delays. In (A) and (B), the gray dashed line at q = 0.07 Å−1 indicates the scattering difference feature peak. Shaded regions indicate the SE from the arithmetic mean replicate measures. (C) Deconvoluted TR, T-Jump SAXS components 1 (blue) and component 2 (red) from the REGALS decomposition of SAXS difference curves for CH505 Env SOSIP (left) and CH848 Env SOSIP (right). The gray dashed line at q = 0.07 Å−1 indicates the location of the feature peak. (D) Fast (blue) and slow (red) time constants from double exponential fits of SVD component 1 for CH505 and CH848 time-resolved data. (E) REGALS pair distance distribution differences for components 1 (blue) and 2 (red) for CH505 (left) and CH848 (right) Env SOSIPs.

