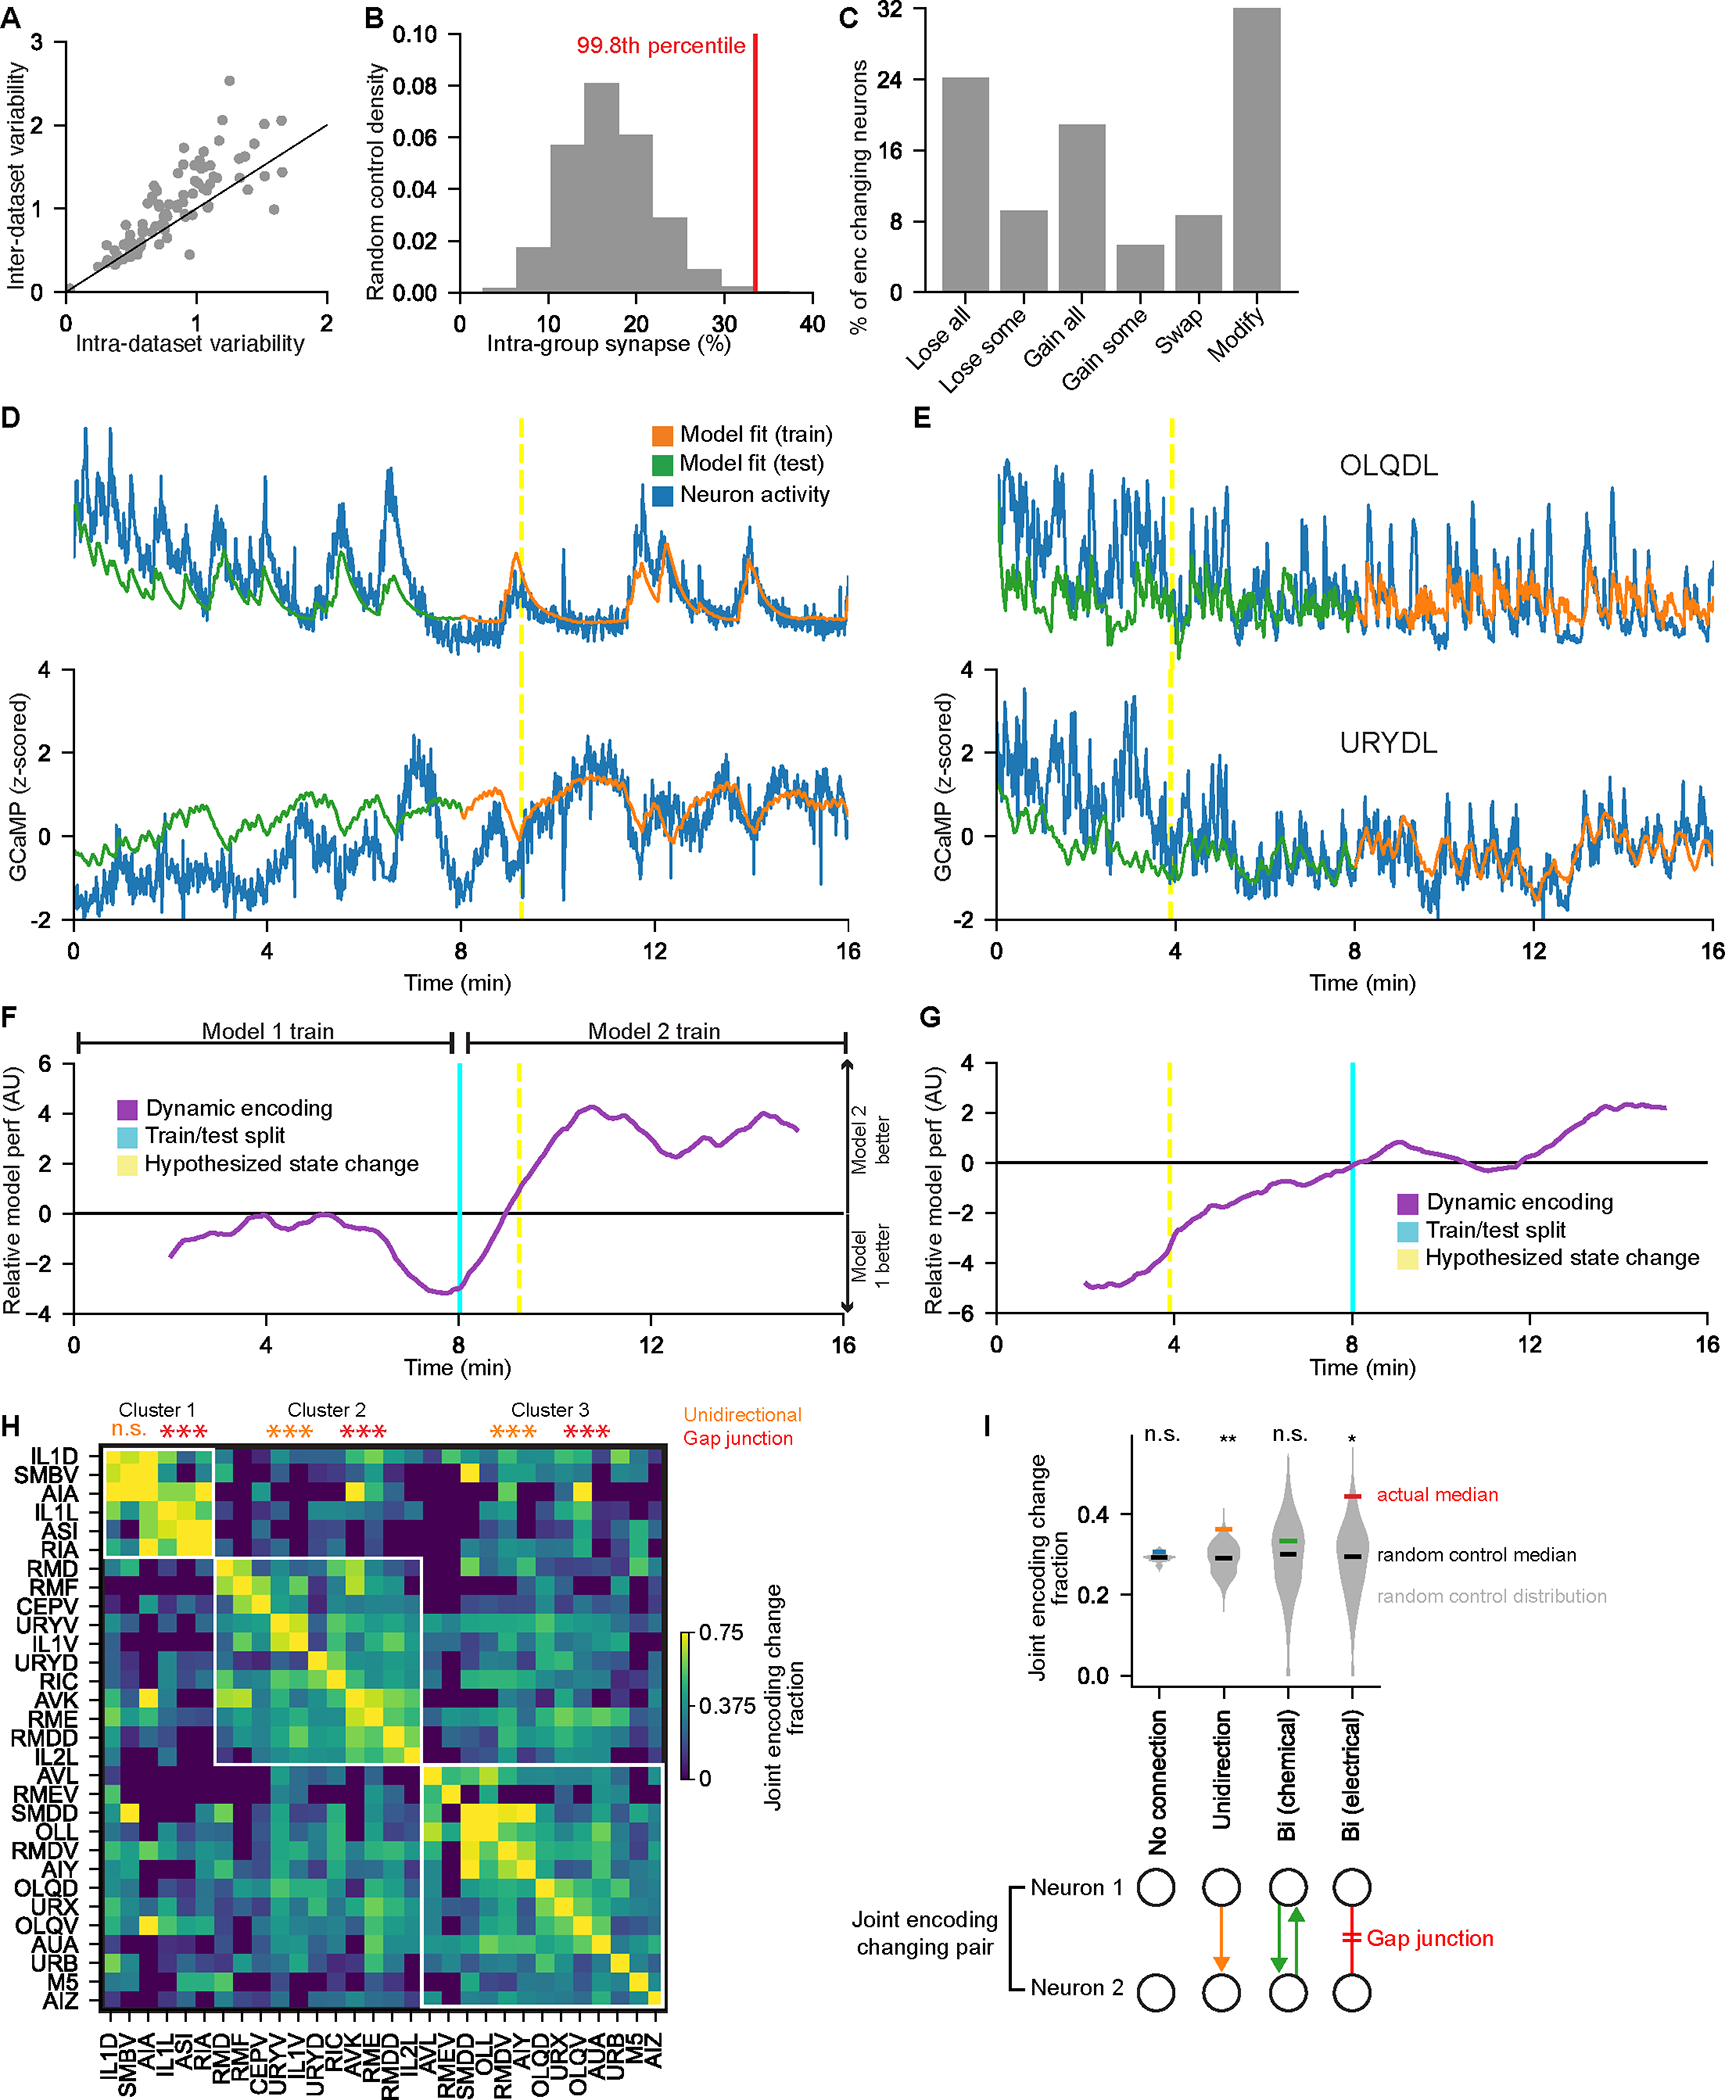
Figure 6. Neural representations of behavior dynamically change over time.

(A) Analysis of inter- versus intra-dataset encoding variability. Each dot is a neuron class.
(B) For the group of neurons that frequently change encoding, red line shows percent of synapses onto these neurons that come from neurons within the group. Gray controls are the same values for random groups of neurons of similar size. Inset percentile shows rank of true number.
(C) How neurons changed encoding across SWF415 animals. Categories are: “lose all” (lost tuning to behavior), “lose some” (lost tuning to one or more behavior), “gain all”, “gain some”, “swap” (both gained and lost tuning to behaviors), and “modify” (encode the same behavior(s), but differently).
(D) Two example neurons with CePNEM fits, showing a change in neural encoding of behavior. Yellow dashed lines indicate times when neurons across the full dataset displayed a sudden shift in encoding (see (F)).
(E) Example neurons OLQDL and URYDL, depicted as in (D).
(F) Data from same animal as (D) showing a sharp change in neural encoding of behavior. We fit CePNEM models to the first and second halves of the recording (Model 1 and Model 2). We then computed the difference between the errors of the two median model fits and smoothened with a 200-timepoint moving average. This was then averaged across encoding changing neurons. A sudden change (yellow line) indicates a sudden shift in behavior encoding across neurons.
(G) Data from the same animal as (E) showing a sudden change in neural encoding, displayed as in (F).
(H) Fraction of times that neuron classes changed encoding at the same moment, relative to their encoding changes overall. Rows were clustered and white outlines depict main clusters. **p<0.005, empirical p-value that clustering would perform as well during random shuffles. Within each cluster, the neurons were more likely to have unidirectional synapses and/or gap junctions with one another compared to random shuffles, as indicated. ***p<0.0005, empirical p-value.
(I) Neuron pairs with unidirectional synapses or electrical synapses were more likely to change encoding together, compared to random shuffles (gray distributions). *p<0.05, **p<0.005, empirical p-value.
See also Figure S6.
