Figure 1.

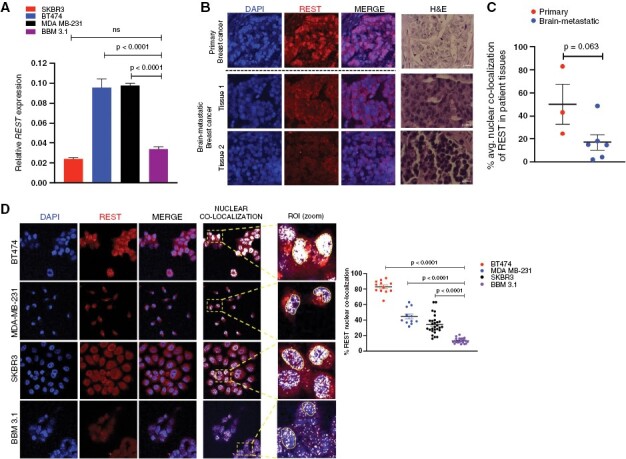
BBMs show reduced nuclear REST. (A) Relative REST mRNA expression in brain-metastatic (BM) breast BBM 3.1 cancer cells, relative to their primary (non-BM) counterparts (mean and SEM, n = 3 per sample) (B) Representative immunofluorescence (IF) images comparing REST protein expression in patient tissues from primary and BM breast cancer. H&E images for each representative tumor tissue included. (C) Quantification for nuclear REST localization in primary (non-BM, n = 3) versus brain metastatic (BM, n = 6) patient tissues. Graph shows comparison of average nuclear REST percentage in each patient in respective groups. (D) Representative IF images, and quantification of nuclear REST localization in non-BM (BT474, MDA MB-231, SKBR3) and patient-derived BM (BBM 3.1) breast cancer cells (magnification ×63; scale 20 µm). Nuclear REST ROI highlighted. Graph shows comparison of percent nuclear REST in individual cells (4 images per sample, 9 cells per image).
