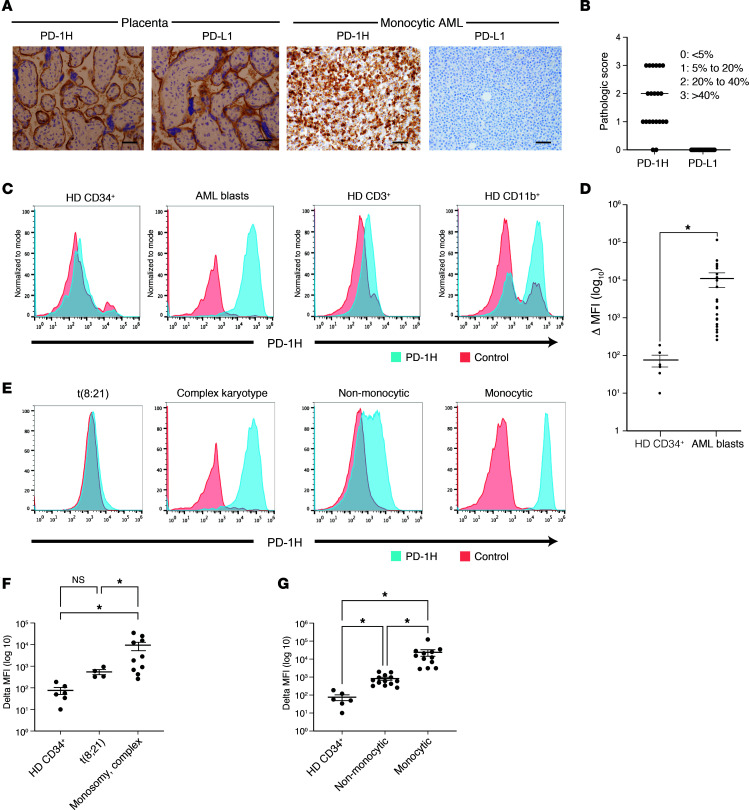
Figure 1. PD-1H protein is highly expressed on AML blasts.
(A) Immunohistochemical staining of human PD-1H and PD-L1 in AML. Validation of PD-1H and PD-L1 staining in human placenta (left panels). IHC staining of PD-1H and PD-L1 in human AML BM core biopsies (right panels) (representative photographs, monocytic AML). Original magnification, ×400. Scale bars: 20 mm. (B) Pathologic score of PD-1H and PD-L1 expression in AML BM core biopsies. Scores of 0, 1, 2, and 3 indicate that less than 5%, 5%–20%, 20%–40%, and more than 40% of AML blasts, respectively, showed PD-1H or PD-L1 expression. (C) Flow cytometric analysis of healthy donor (HD) CD34+ cells (far left), AML blasts (either CD34+ or CD33+) (second panel), HD CD11b+ myeloid cells (third panel), and HD CD3+ T cells (far right). (D) Change in (Δ) MFI (MFI in PD-1H staining–MFI in isotype staining). Mean value of ΔMFI in HD CD34+ progenitors versus mean value of ΔMFI in AML CD34+ blasts = 76 ± 26.8 (n = 5) versus 11,469 ± 4,873 (n = 26), P = 0.02. P value determined by Student’s t test. Error bars represent SEM. (E) Flow cytometric analysis of AML subsets (t[8;21], complex karyotype, nonmonocytic, and monocytic). (F) Mean value of ΔMFI in t(8;21) versus in monosomic complex karyotype AML (551 ± 145 [n = 4] versus 9,469 ± 3,880 [n = 8]). P value determined by 1-way ANOVA. Error bars represent SEM. *P < 0.05. (G) Mean value of ΔMFI in nonmonocytic versus monocytic AML (822 ± 155 [n = 19] versus 23,881 ± 9,533 [n = 7]). P value determined by 1-way ANOVA. Error bars represent SEM. *P <0.05.

